Phytoplankton Report
Introduction
The Department of Water Resources (DWR) and the US Bureau of Reclamation (USBR) are required by Water Right Decision 1641 (D-1641) to collect phytoplankton and chlorophyll a samples to monitor algal community composition and biomass at select sites in the upper San Francisco Estuary (Estuary). This report describes the results of these monitoring efforts for water year 2024 (October 1st 2023 through September 30th 2024) which was classified as above normal in the Sacramento and San Joaquin Valleys (source).
Methods
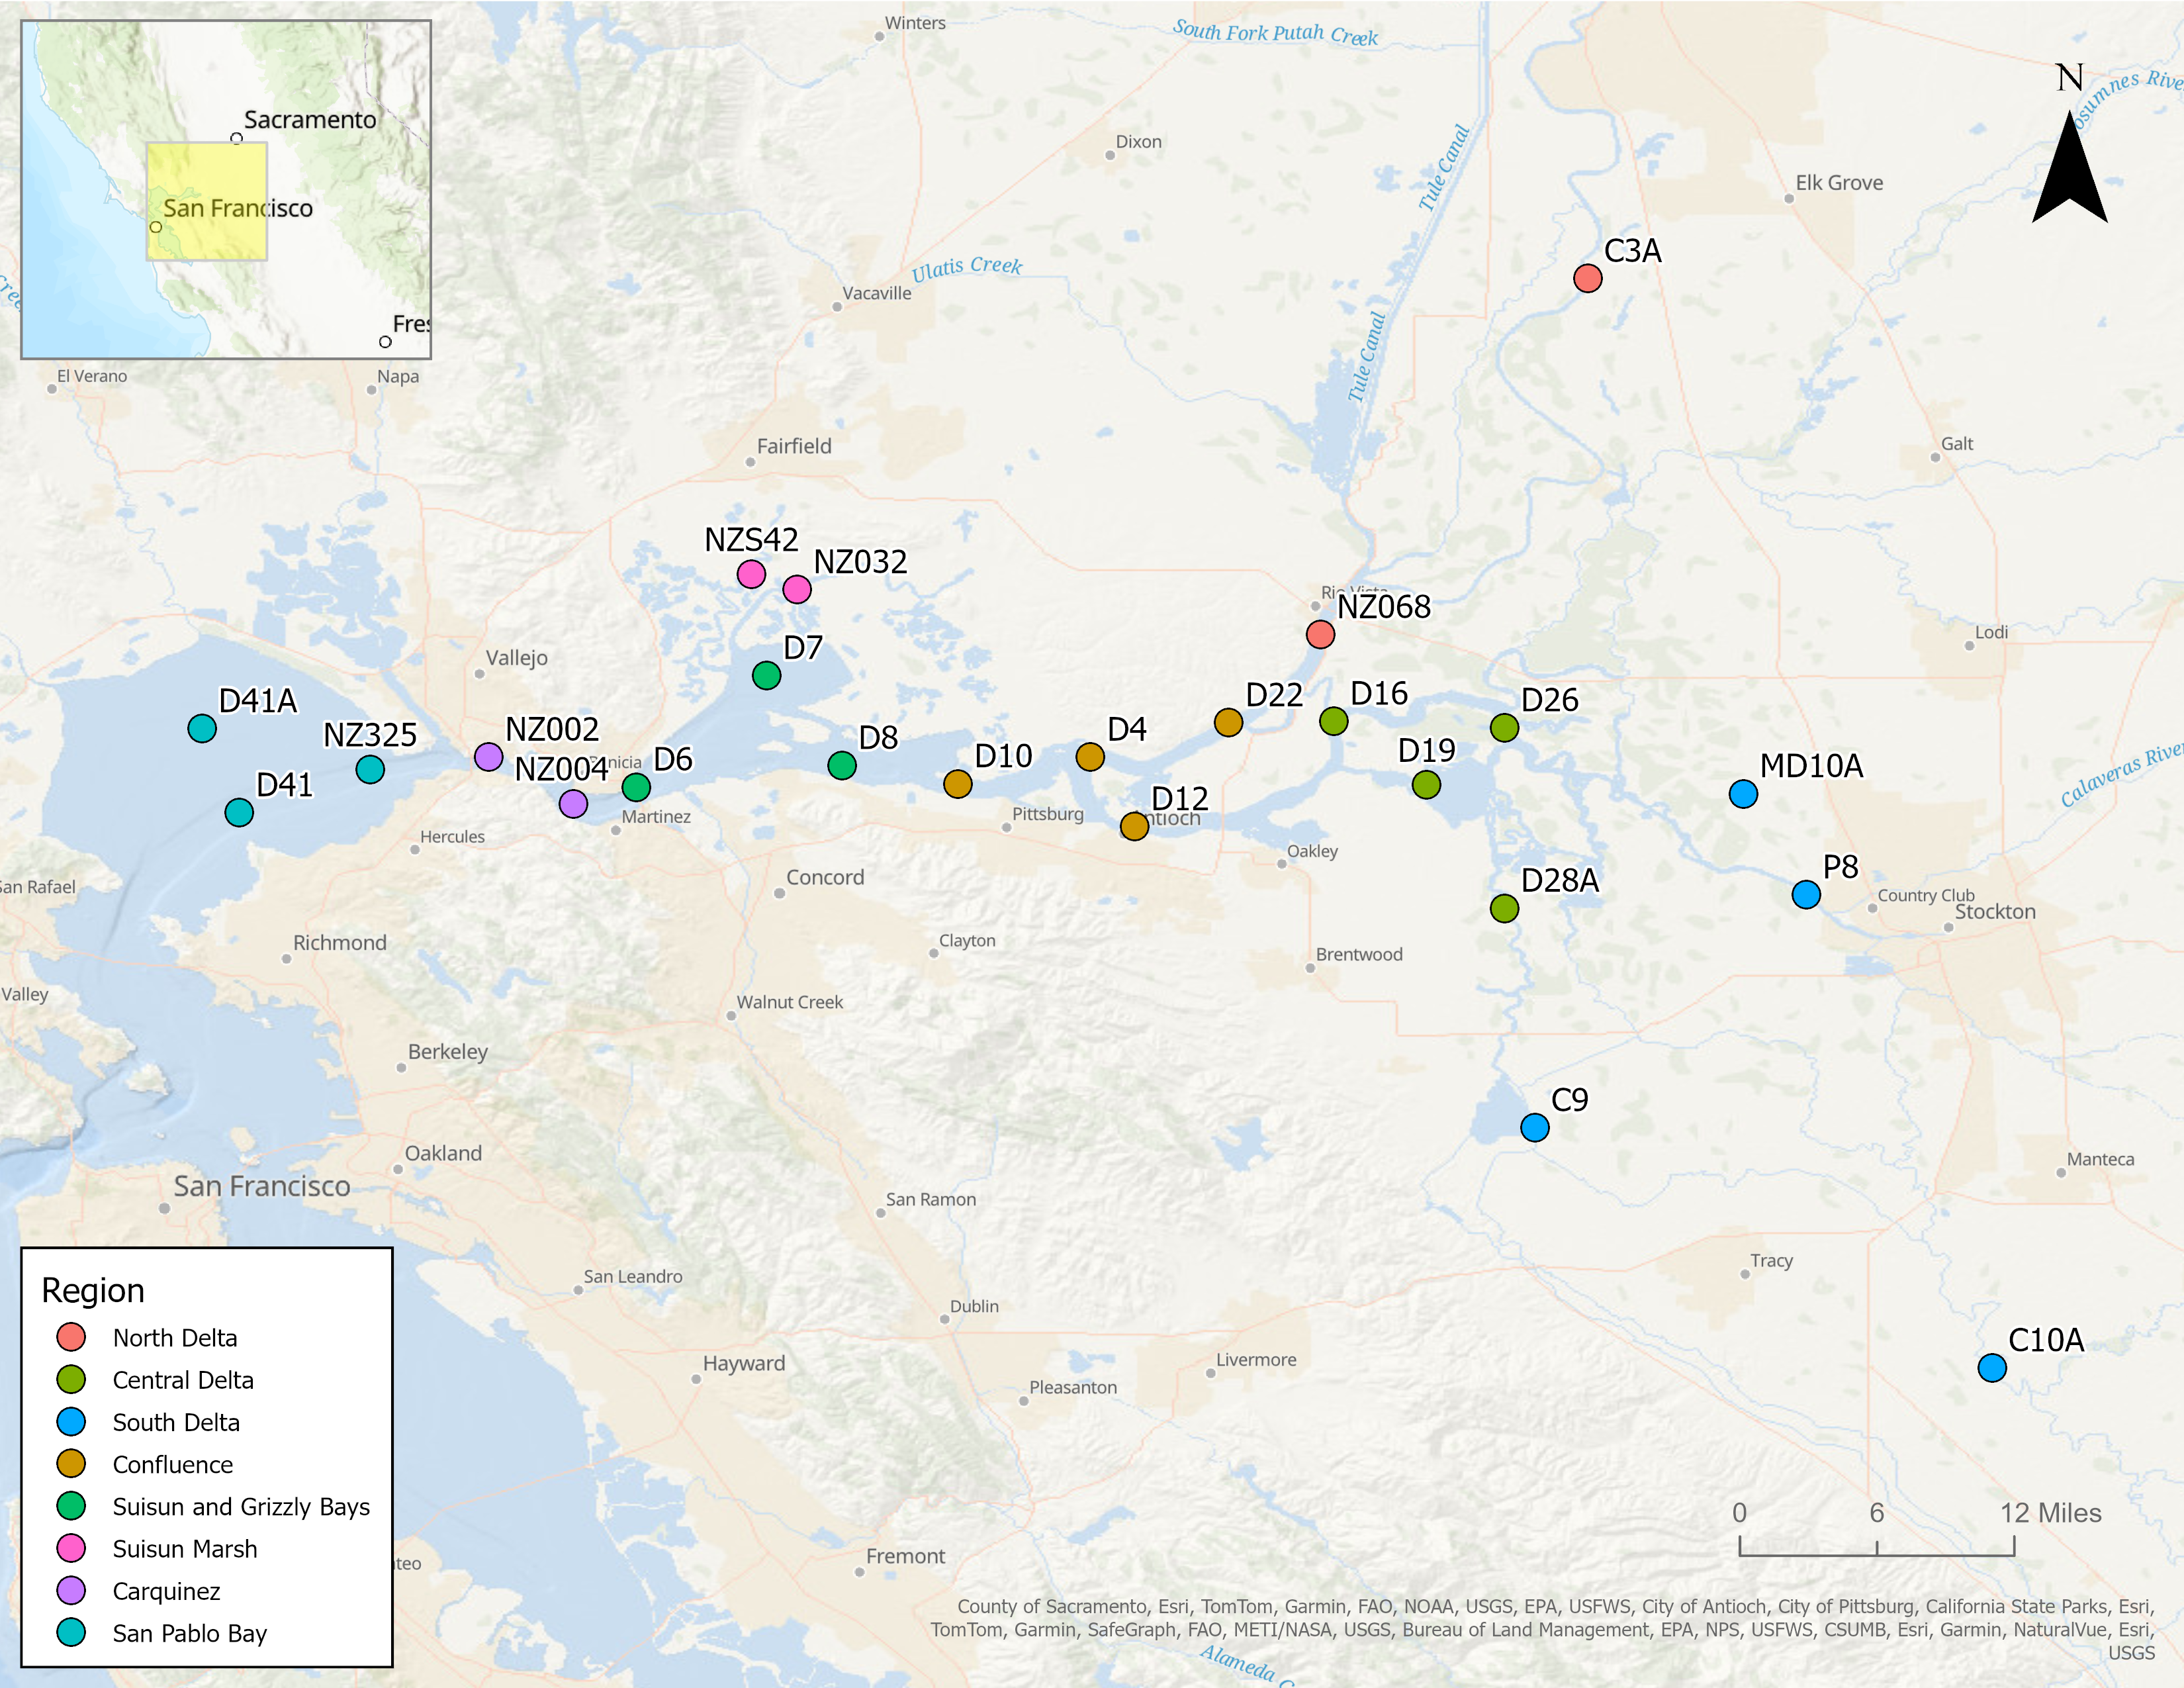
Phytoplankton samples were collected monthly at 24 monitoring sites throughout the Upper Estuary and were grouped into regions based on their geographic location (Figure 1; Table 1). These sites represent a variety of aquatic habitats, from narrow, freshwater channels to broad, estuarine bays.
| Region | WY Index | Stations |
|---|---|---|
| Carquinez | Sacramento | NZ002, NZ004 |
| Central Delta | San Joaquin | D16, D19, D26, D28A |
| Confluence | Sacramento | D4, D10, D12, D22 |
| North Delta | Sacramento | C3A, NZ068 |
| San Pablo Bay | Sacramento | D41, D41A, NZ325 |
| South Delta | San Joaquin | C9, C10A, MD10A, P8 |
| Suisun and Grizzly Bays | Sacramento | D6, D7, D8 |
| Suisun Marsh | Sacramento | NZ032, NZS42 |
Phytoplankton
The 10 most common genera were determined by summing the normalized organism counts across all stations and months for each genus. For the bar graphs, average organism counts were calculated per month, per region, and normalized to the number of stations. Average summary statistics are reported as the mean (μ) ± the standard deviation.
For more in-depth methodology, see here.
Chlorophyll a and Pheophytin a
Samples of chlorophyll a and pheophytin a were collected monthly at 24 monitoring sites throughout the upper Estuary using a submersible pump positioned 1 meter below the water’s surface. Average analyte concentrations were then calculated per month, per region, and were normalized to the number of stations. Average summary statistics are reported as the median (M) ± the median absolute deviation.
For more in-depth methodology, see here.
Overall Results
Phytoplankton Identification
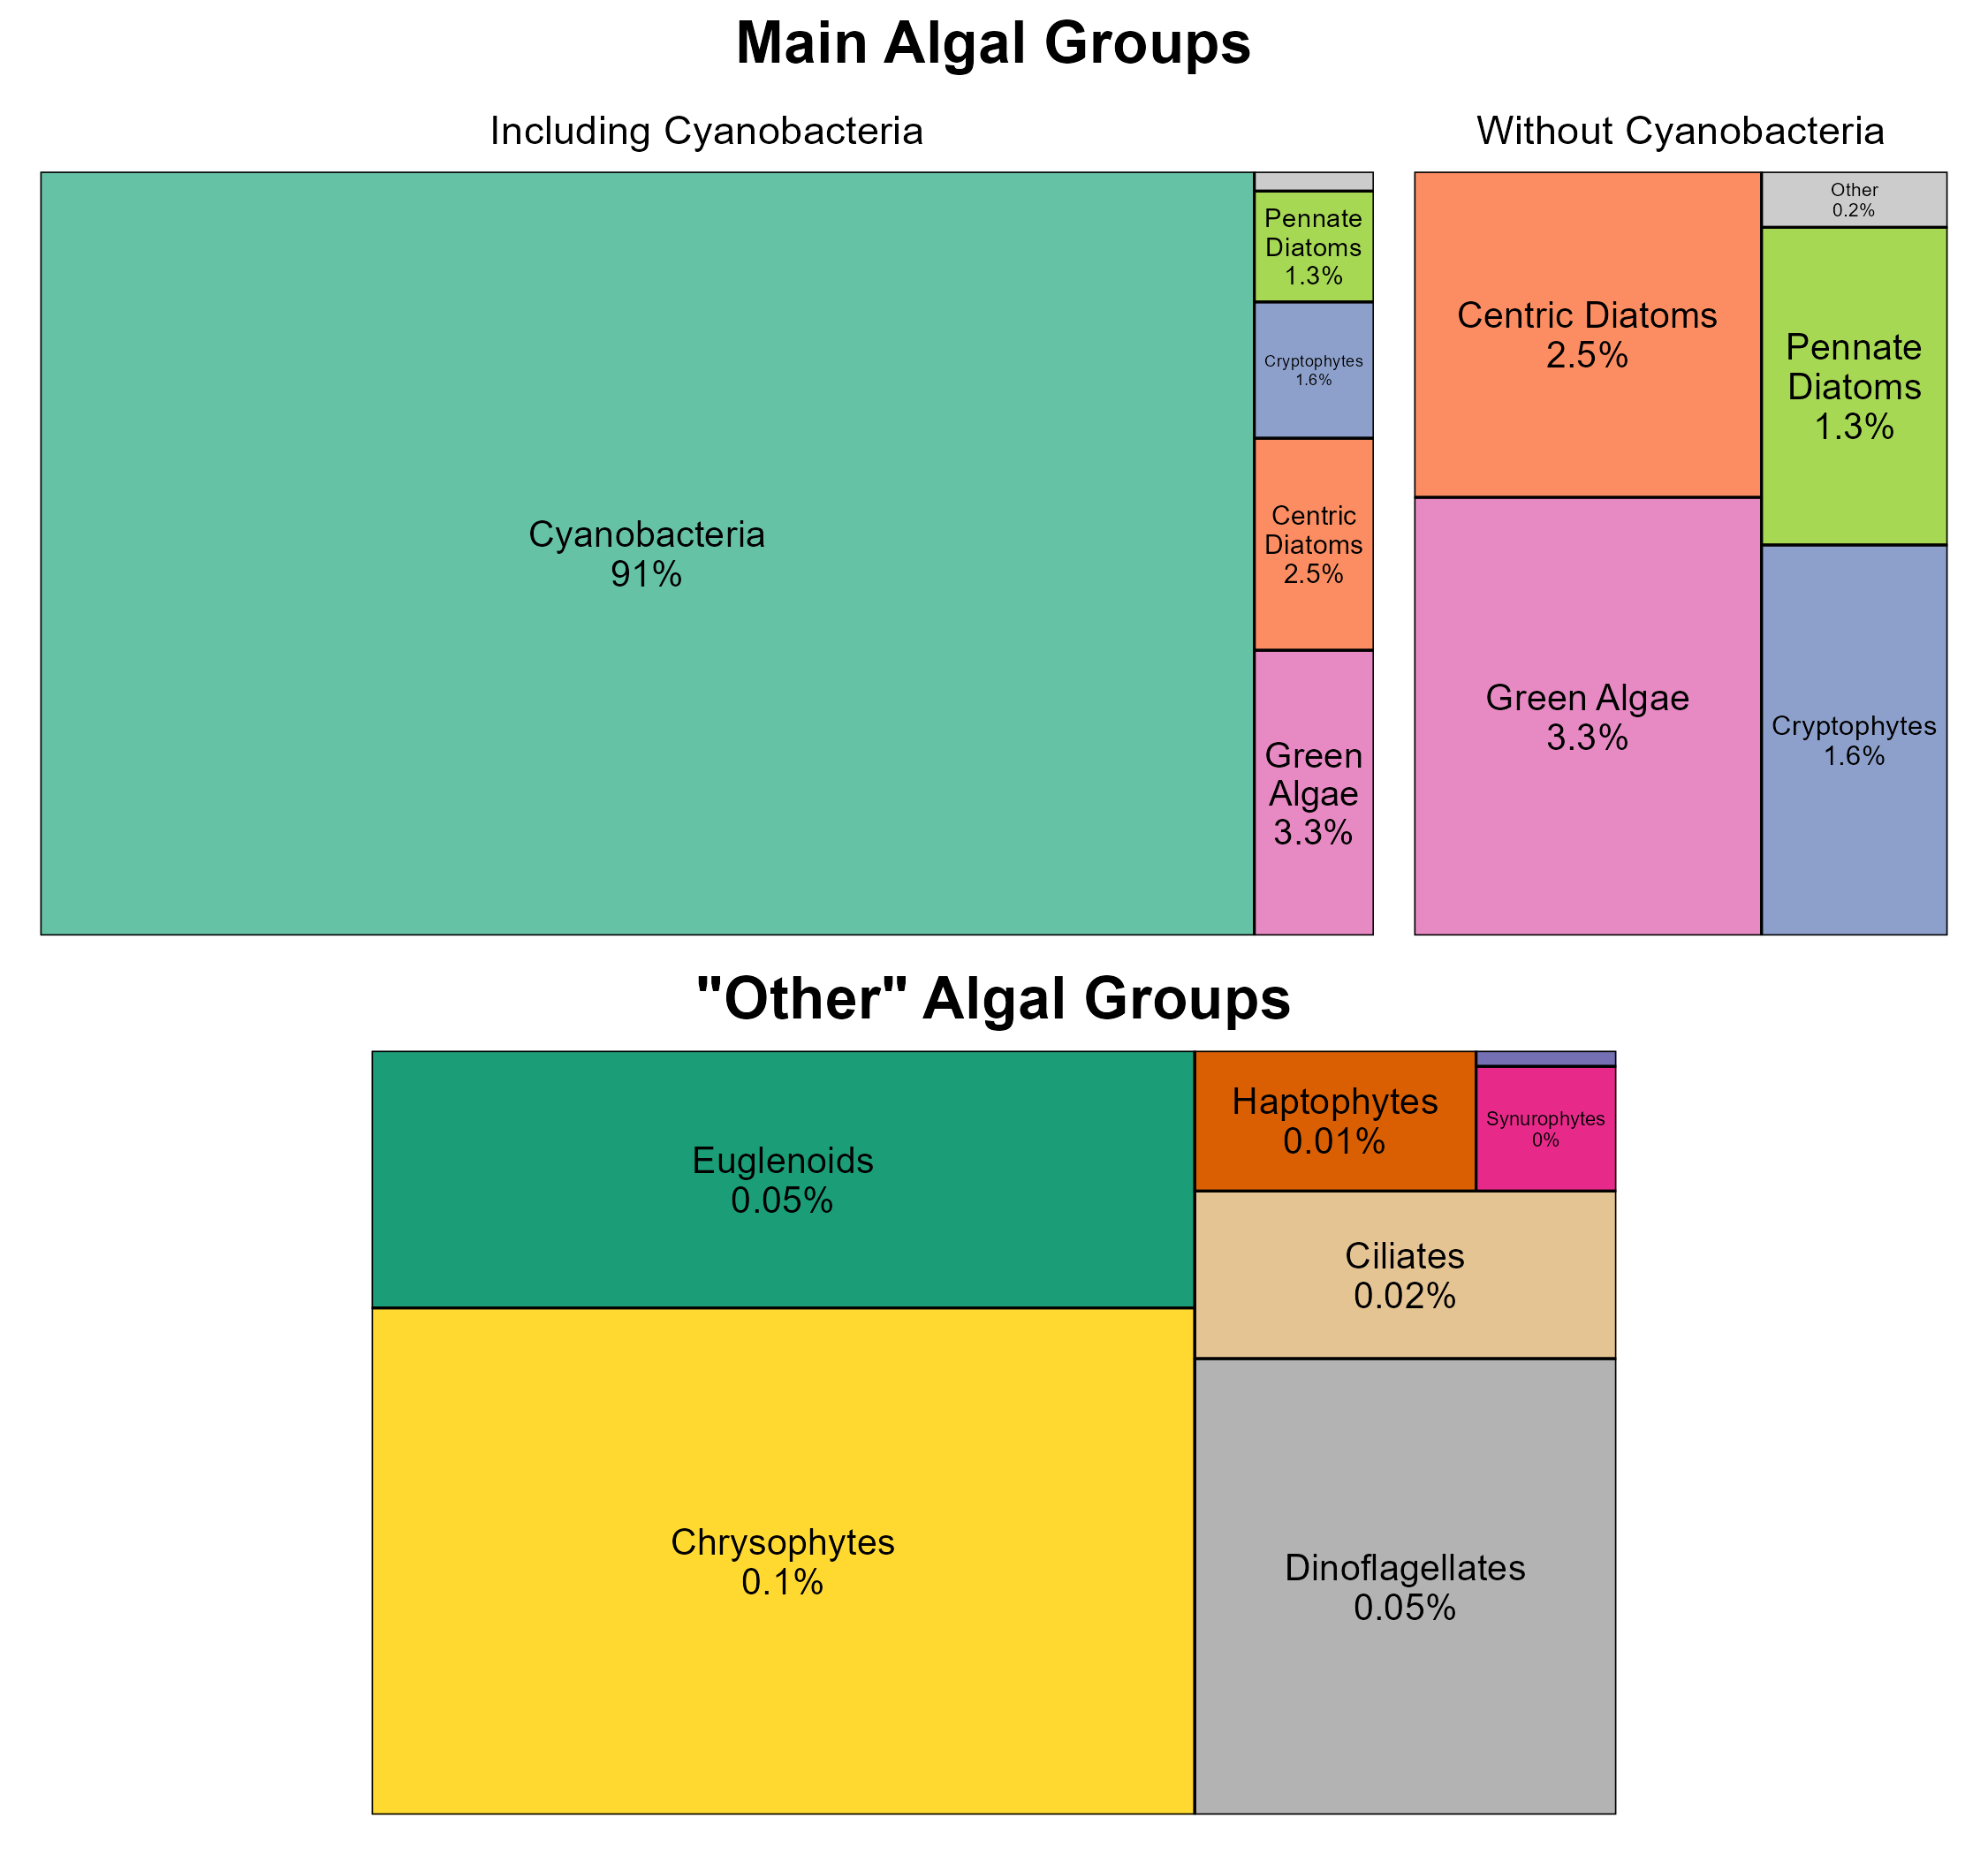
All organisms collected in water year 2024 fell into these 10 algal groups:
• Centric Diatoms
• Chrysophytes
• Ciliates
• Coccolithophores
• Cryptophytes
• Cyanobacteria
• Dinoflagellates
• Euglenoids
• Green Algae
• Pennate Diatoms
The 10 most common genera collected in water year 2024 were, in order:
• Eucapsis (cyanobacteria)
• Chlorella (green algae)
• Cyclotella (centric diatoms)
• Plagioselmis (cryptophytes)
• Skeletonema (centric diatoms)
• Microcystis (cyanobacteria)
• Nitzschia (pennate diatoms)
• Teleaulax (cryptophytes)
• Monoraphidium (green algae)
• Cocconeis (pennate diatoms)
Of the groups identified, centric diatoms, cryptophytes, cyanobacteria, green algae, and pennate diatoms constituted 99.83% of the organisms collected (Figure 2).
Pigment Concentrations
98.56% of samples had chlorophyll a levels below 10 μg/L, which is considered limiting for zooplankton growth (Müller-Solger et al., 2002). The average chlorophyll a value was 1.96 ± 0.66 µg/L; values ranged from 0.59 µg/L to 53.10 µg/L. The average pheophytin a value was 0.61 ± 0.12 µg/L; values ranged from < 0.50 µg/L to 11.10 µg/L. 32.01% of samples were below the reporting limit.
Regional Results
Carquinez
Water Quality
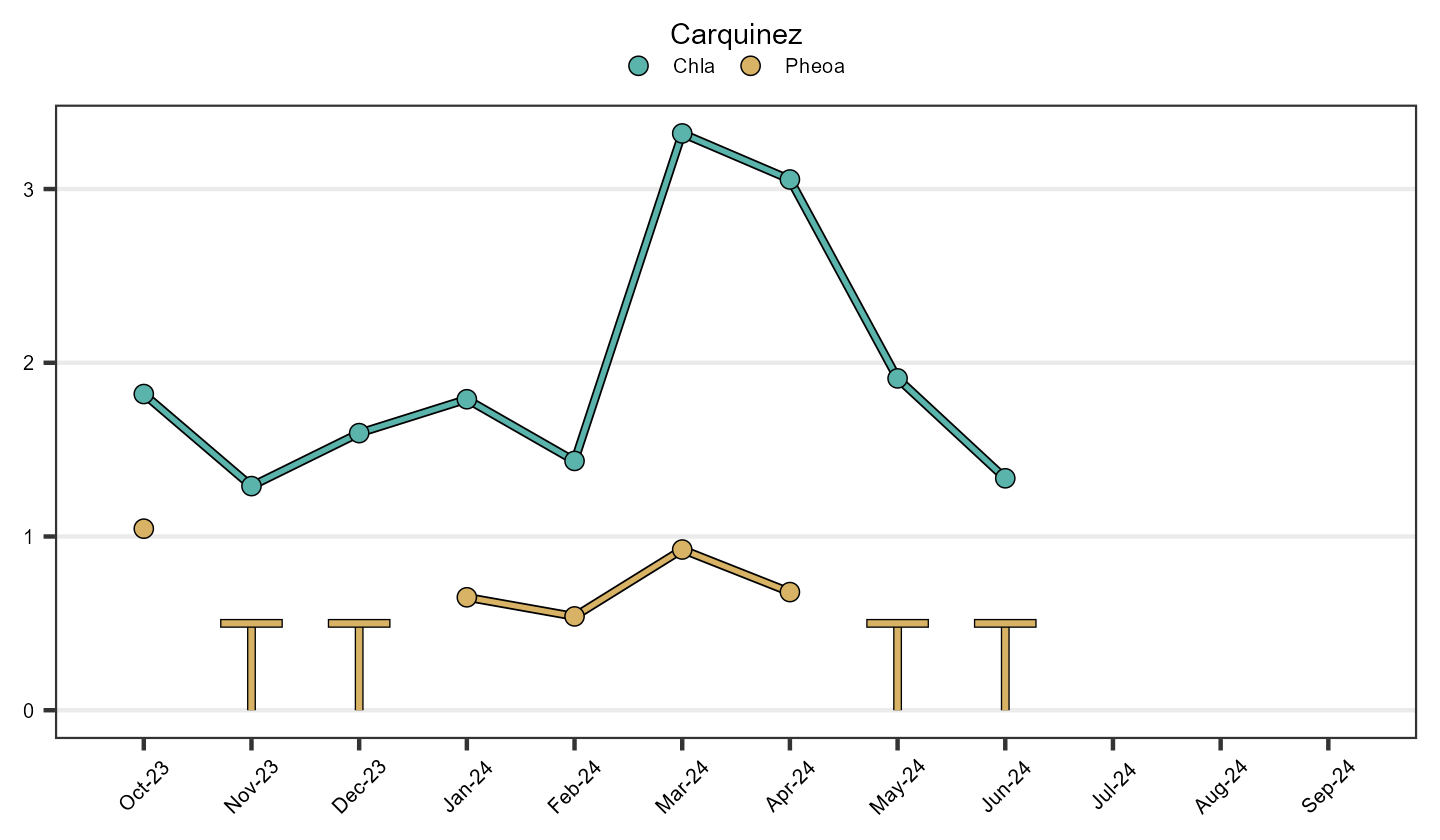
The average chlorophyll a value was 1.79 ± 0.38 µg/L; values ranged from 0.89 µg/L to 4.59 µg/L. The average pheophytin a value was 0.50 ± 0.12 µg/L; values ranged from < 0.50 µg/L to 1.59 µg/L. 55.56% of samples were below the reporting limit. Time series plots averaged over region are shown in Figure 3.
Phytoplankton
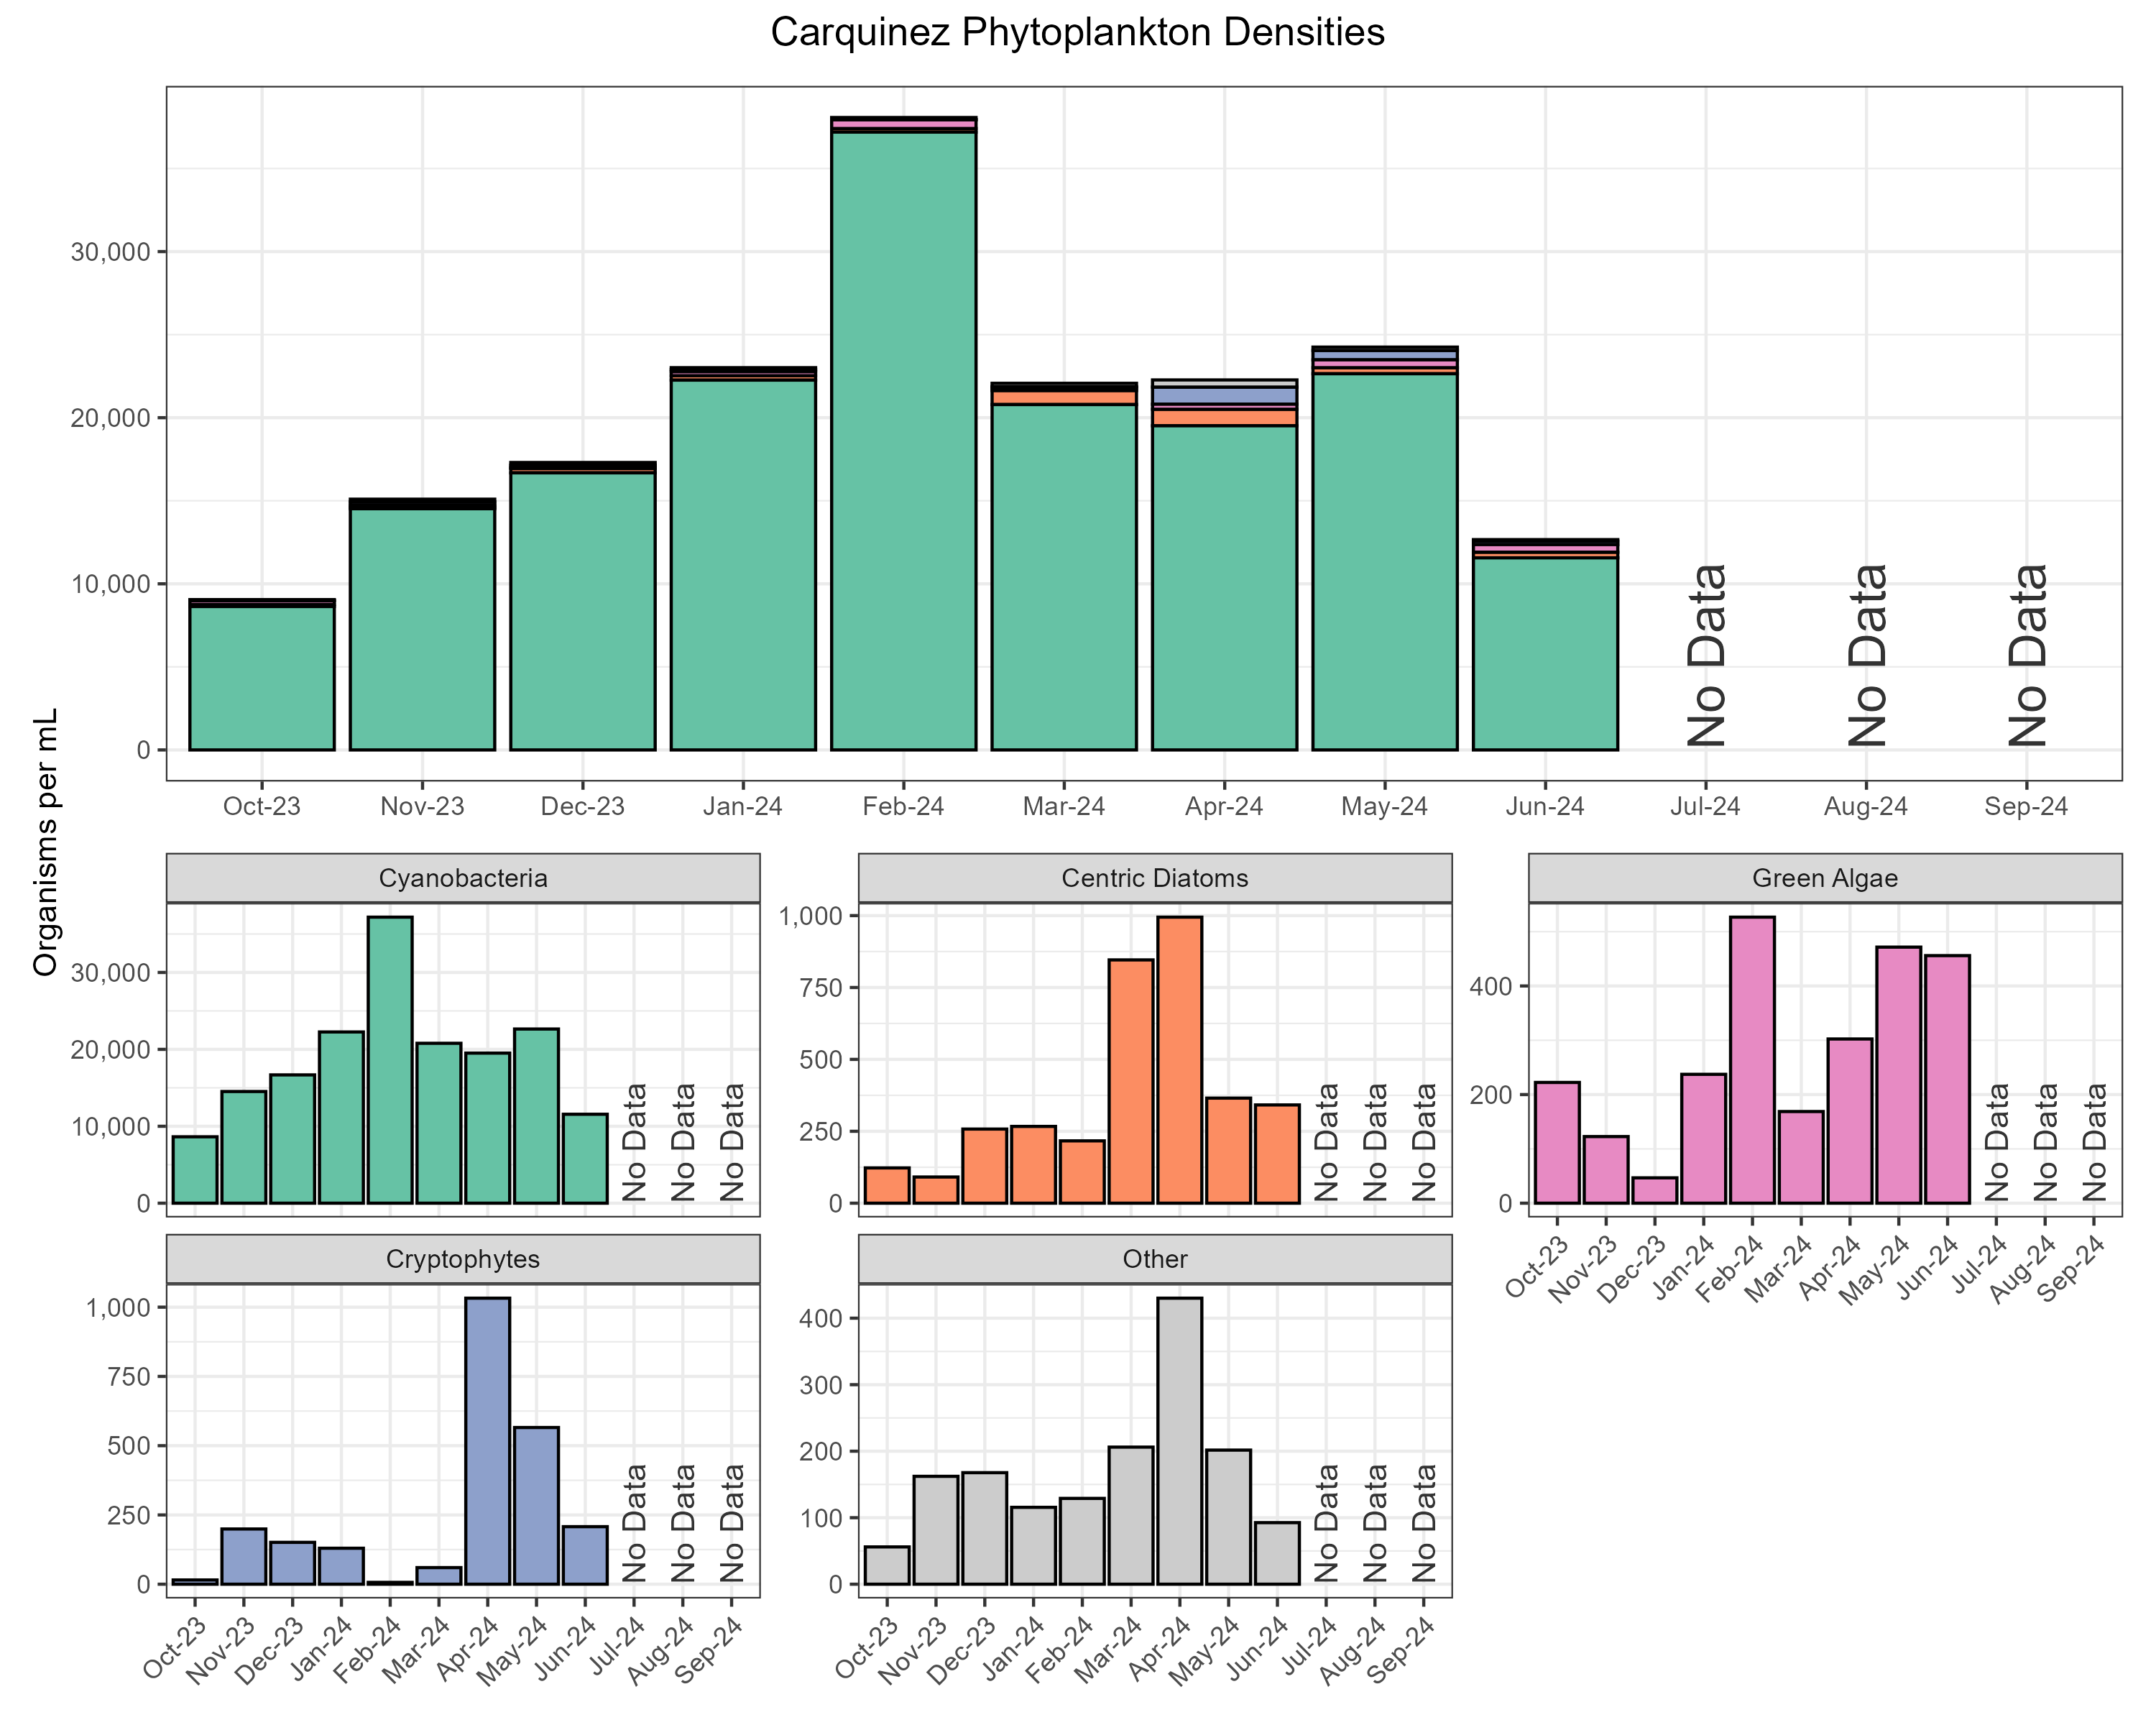
The most abundant algal groups were cyanobacteria (95.1% of organisms, µ = 19310 ± 14404 organisms/mL), centric diatoms (1.8% of organisms, µ = 356 ± 297 organisms/mL), green algae (1.3% of organisms, µ = 269 ± 291 organisms/mL), and cryptophytes (1.2% of organisms, µ = 241 ± 216 organisms/mL). The remaining 0.7% of organisms were comprised of chrysophytes, coccolithophores, dinoflagellates, euglenoids, and pennate diatoms (Other, Figure 4).
Central Delta
Water Quality
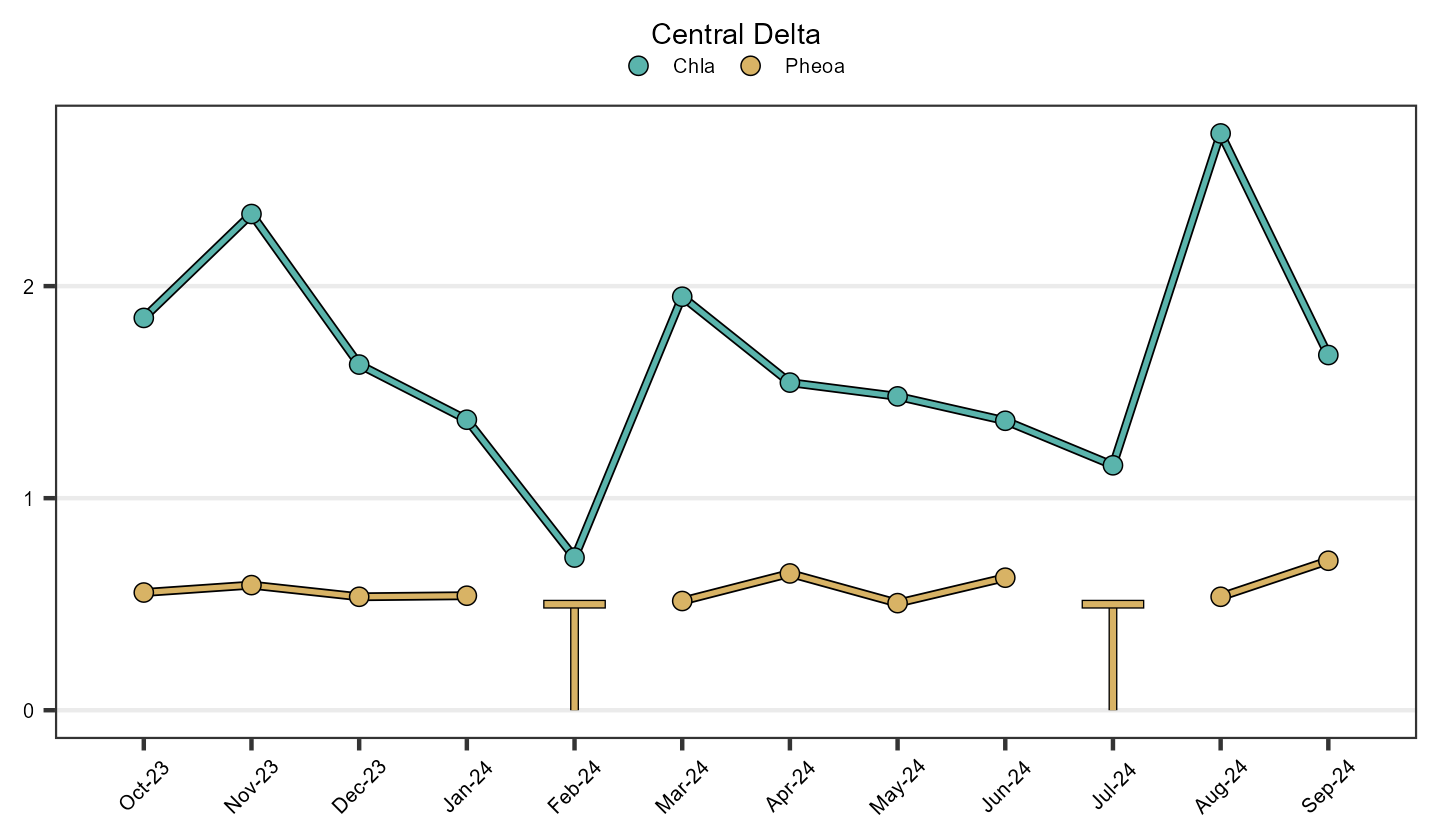
The average chlorophyll a value was 1.57 ± 0.51 µg/L; values ranged from 0.59 µg/L to 4.90 µg/L. The average pheophytin a value was 0.55 ± 0.12 µg/L; values ranged from < 0.50 µg/L to 0.97 µg/L. 37.5% of samples were below the reporting limit. Time series plots averaged over region are shown in Figure 5.
Phytoplankton
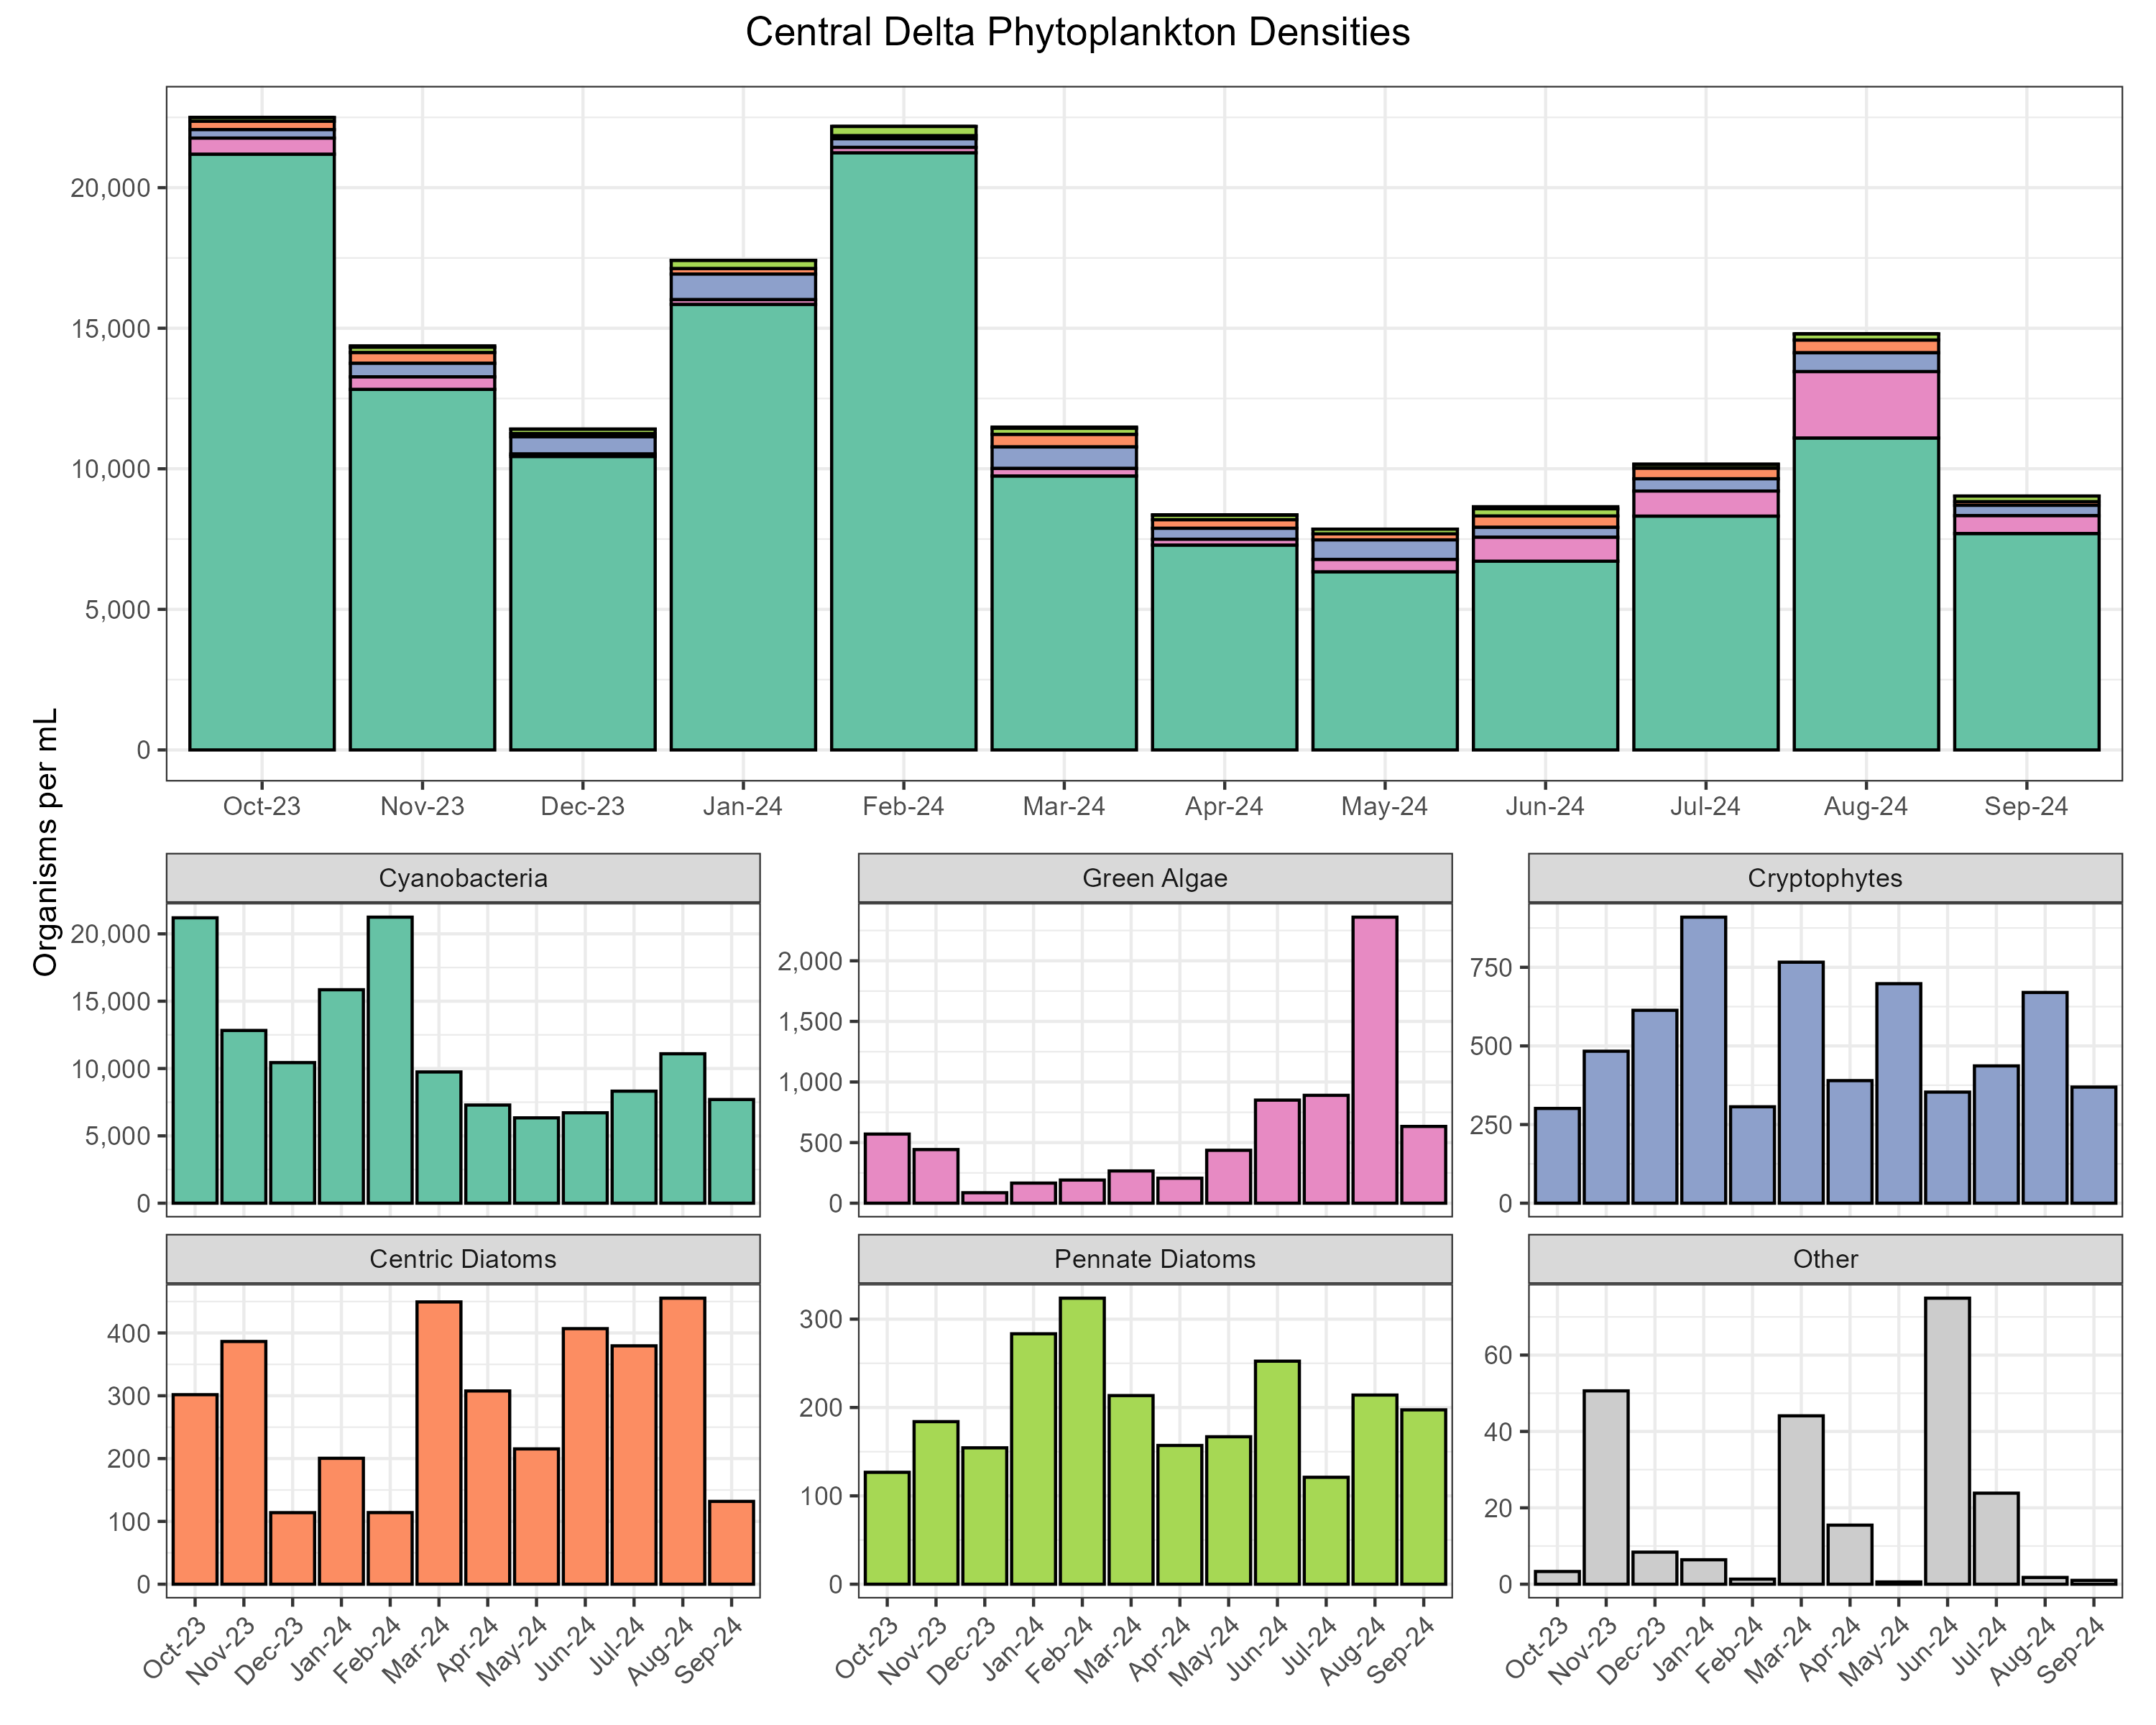
The most abundant algal groups were cyanobacteria (88.5% of organisms, µ = 11547 ± 16739 organisms/mL), green algae (4.4% of organisms, µ = 573 ± 941 organisms/mL), cryptophytes (3.8% of organisms, µ = 496 ± 581 organisms/mL), centric diatoms (2% of organisms, µ = 258 ± 252 organisms/mL), and pennate diatoms (1.2% of organisms, µ = 154 ± 182 organisms/mL). The remaining 0.1% of organisms were comprised of chrysophytes, coccolithophores, dinoflagellates, and euglenoids (Other, Figure 6).
Confluence
Water Quality
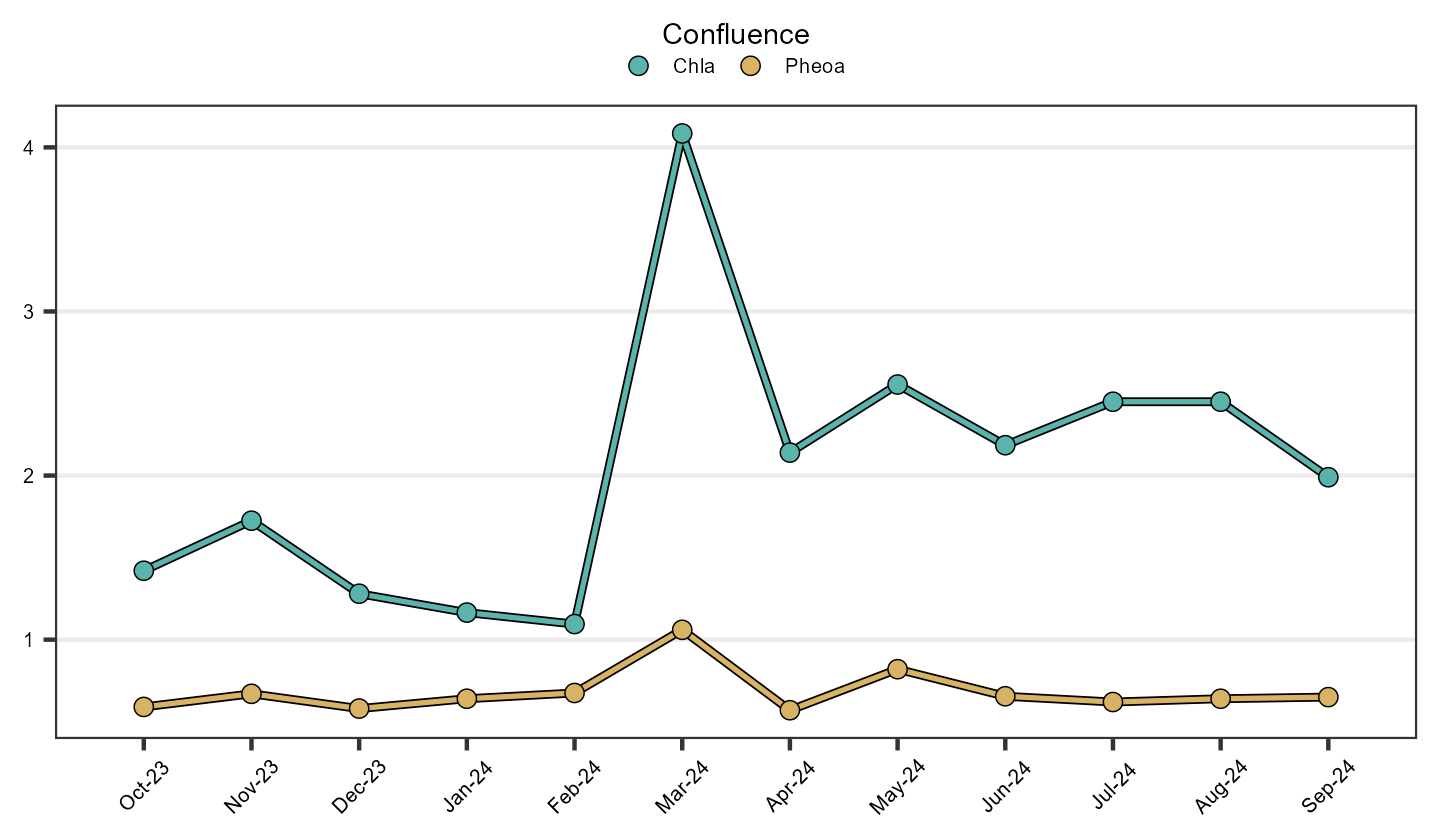
The average chlorophyll a value was 2.03 ± 0.59 µg/L; values ranged from 0.86 µg/L to 4.18 µg/L. The average pheophytin a value was 0.65 ± 0.12 µg/L; values ranged from < 0.50 µg/L to 1.10 µg/L. 18.75% of samples were below the reporting limit. Time series plots averaged over region are shown in Figure 7.
Phytoplankton
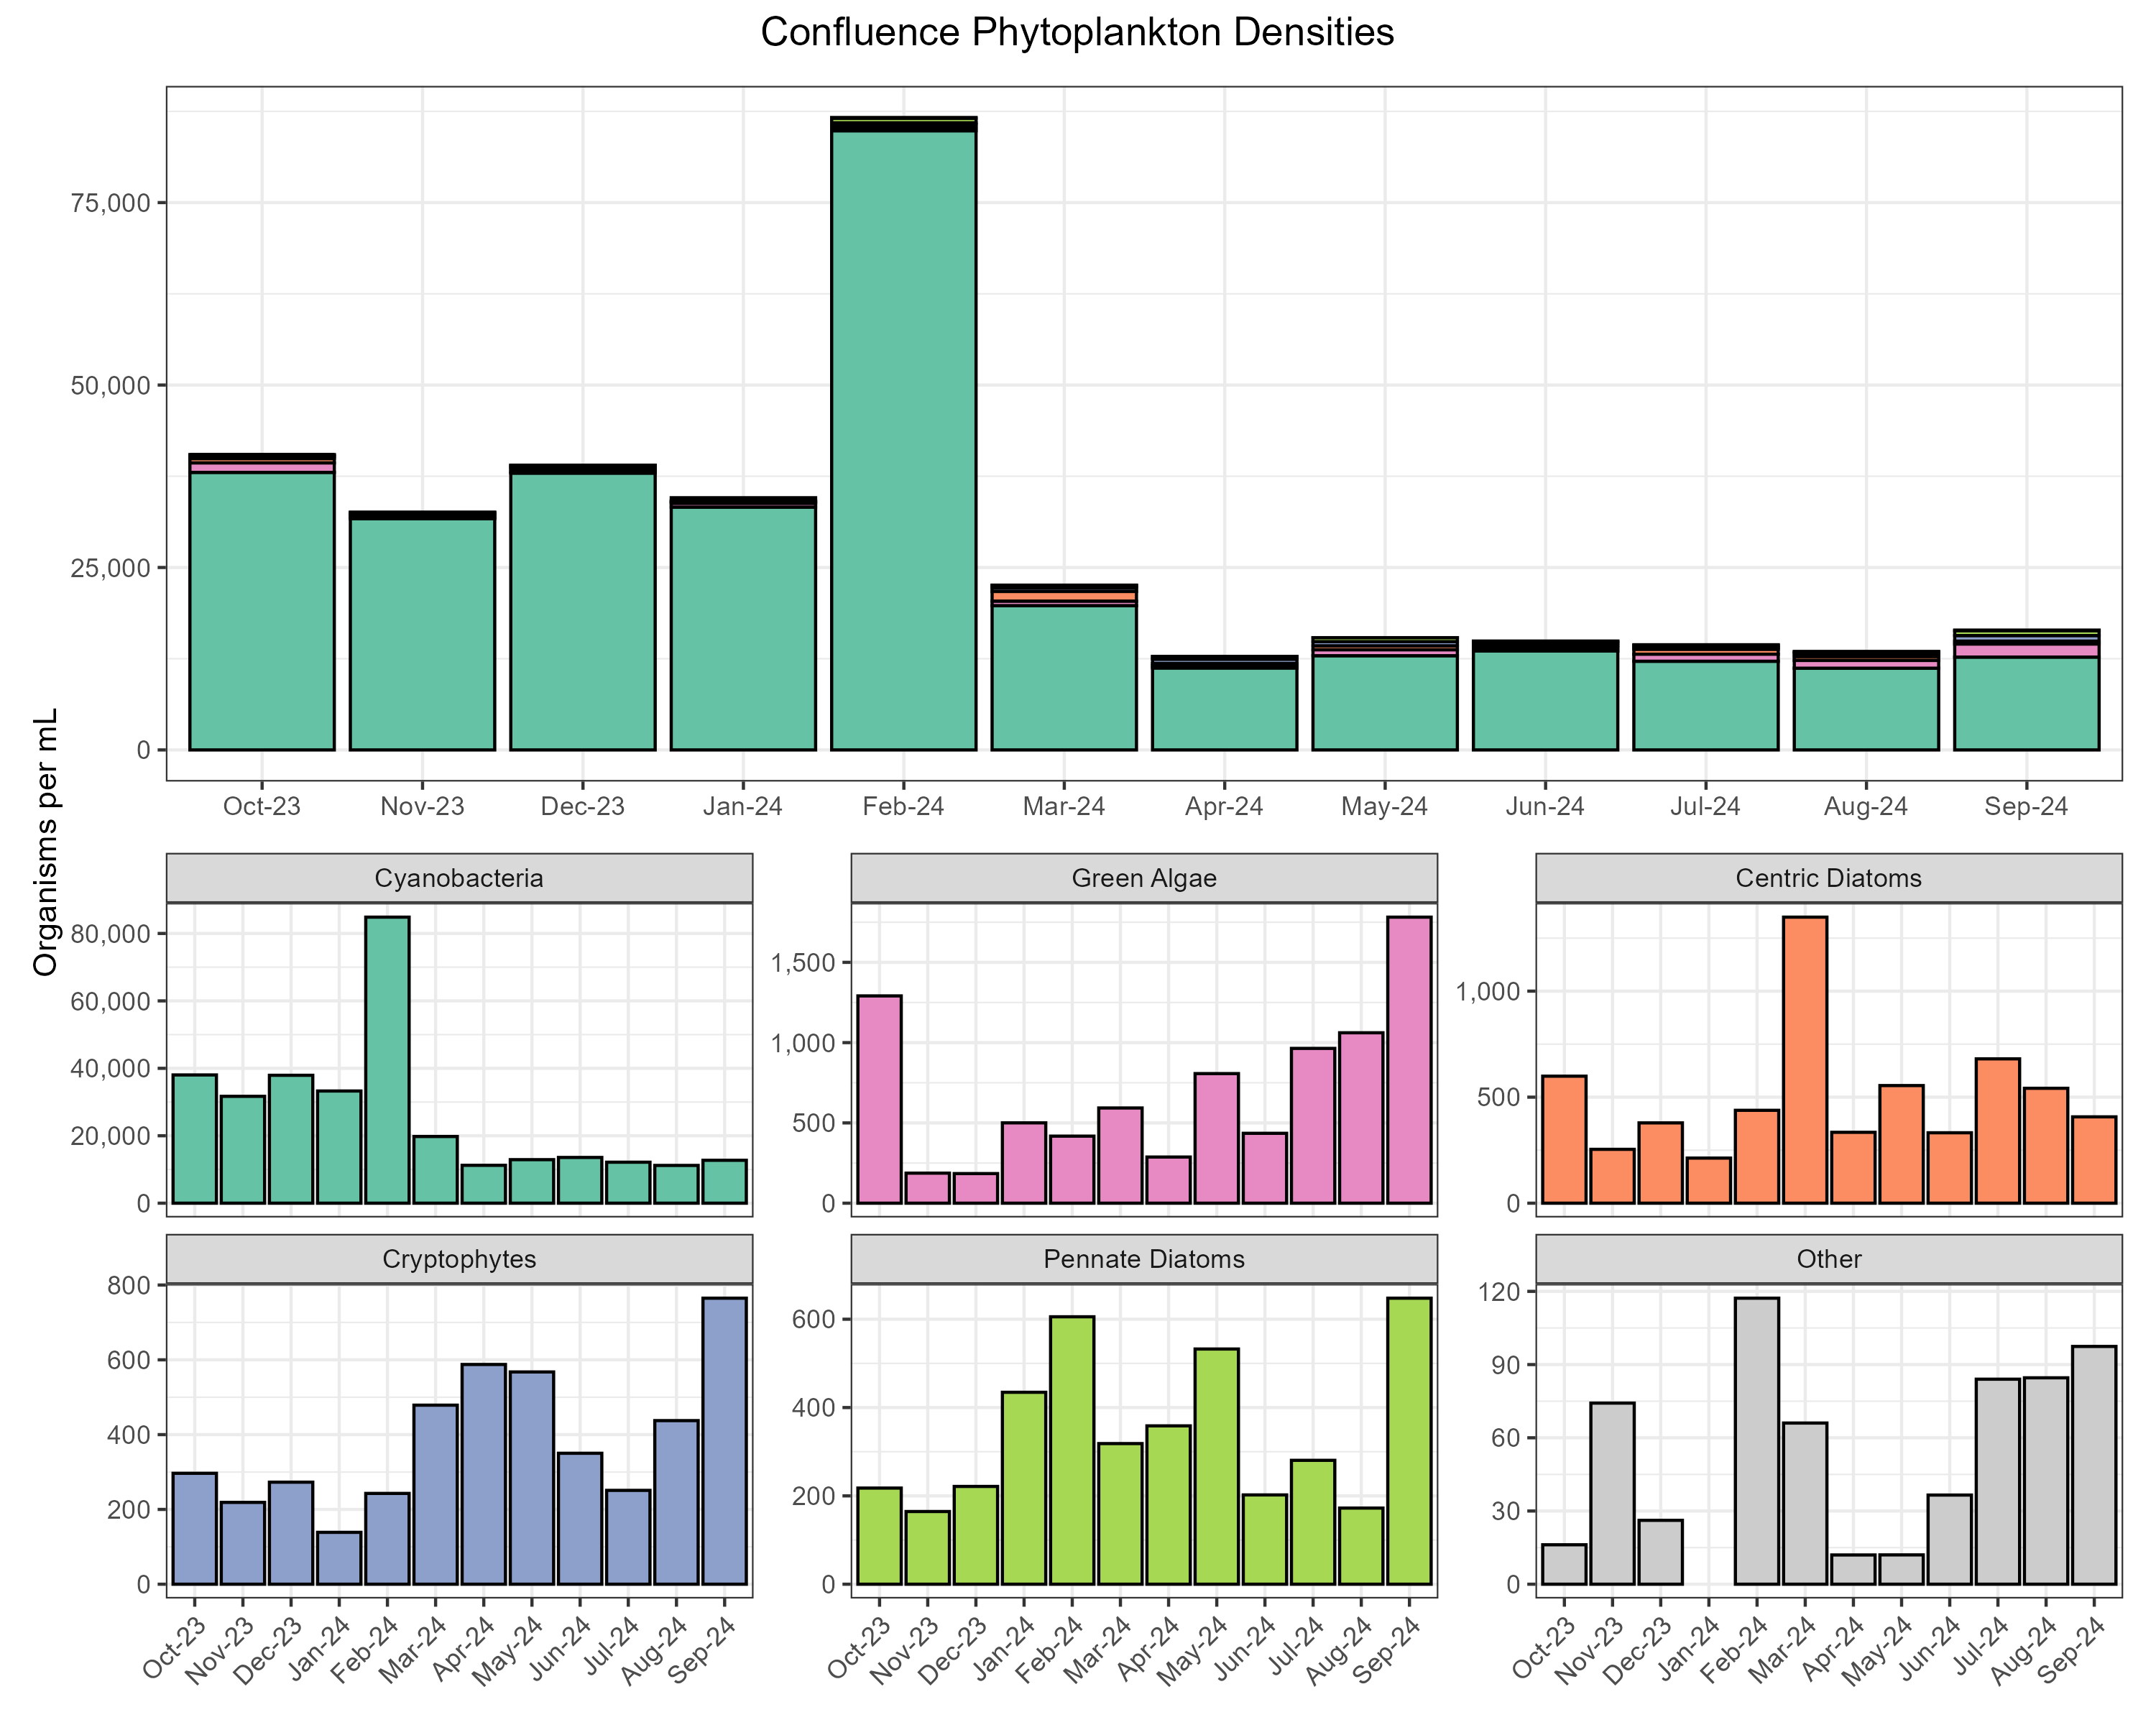
The most abundant algal groups were cyanobacteria (93.8% of organisms, µ = 26602 ± 33803 organisms/mL), green algae (2.4% of organisms, µ = 686 ± 912 organisms/mL), centric diatoms (1.5% of organisms, µ = 438 ± 433 organisms/mL), and cryptophytes (1.2% of organisms, µ = 336 ± 305 organisms/mL). The remaining 1.1% of organisms were comprised of chrysophytes, dinoflagellates, euglenoids, and pennate diatoms (Other, Figure 8).
North Delta
Water Quality
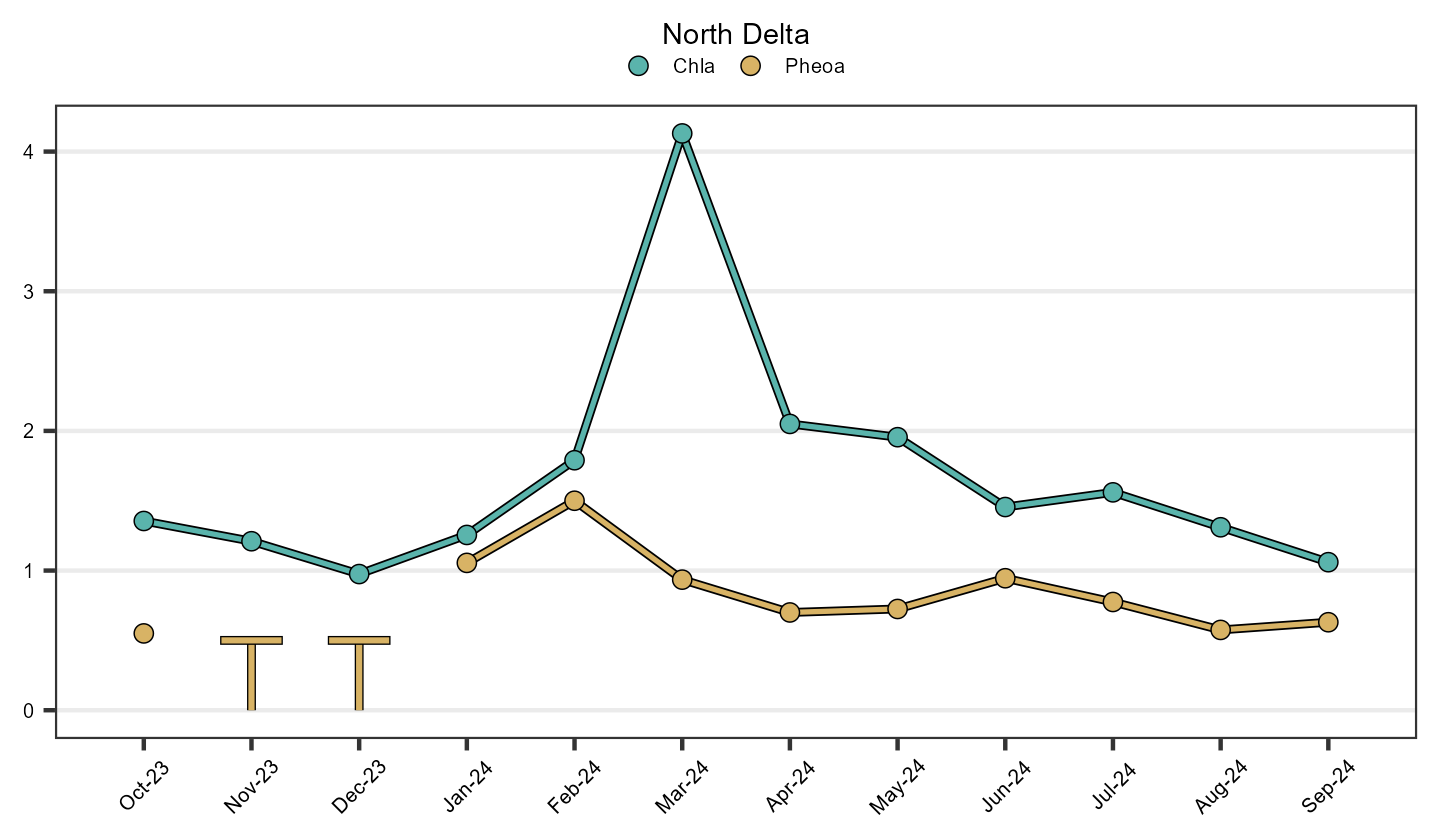
The average chlorophyll a value was 1.46 ± 0.66 µg/L; values ranged from 0.76 µg/L to 4.18 µg/L. The average pheophytin a value was 0.62 ± 0.12 µg/L; values ranged from < 0.50 µg/L to 1.78 µg/L. 41.67% of samples were below the reporting limit. Time series plots averaged over region are shown in Figure 9.
Phytoplankton
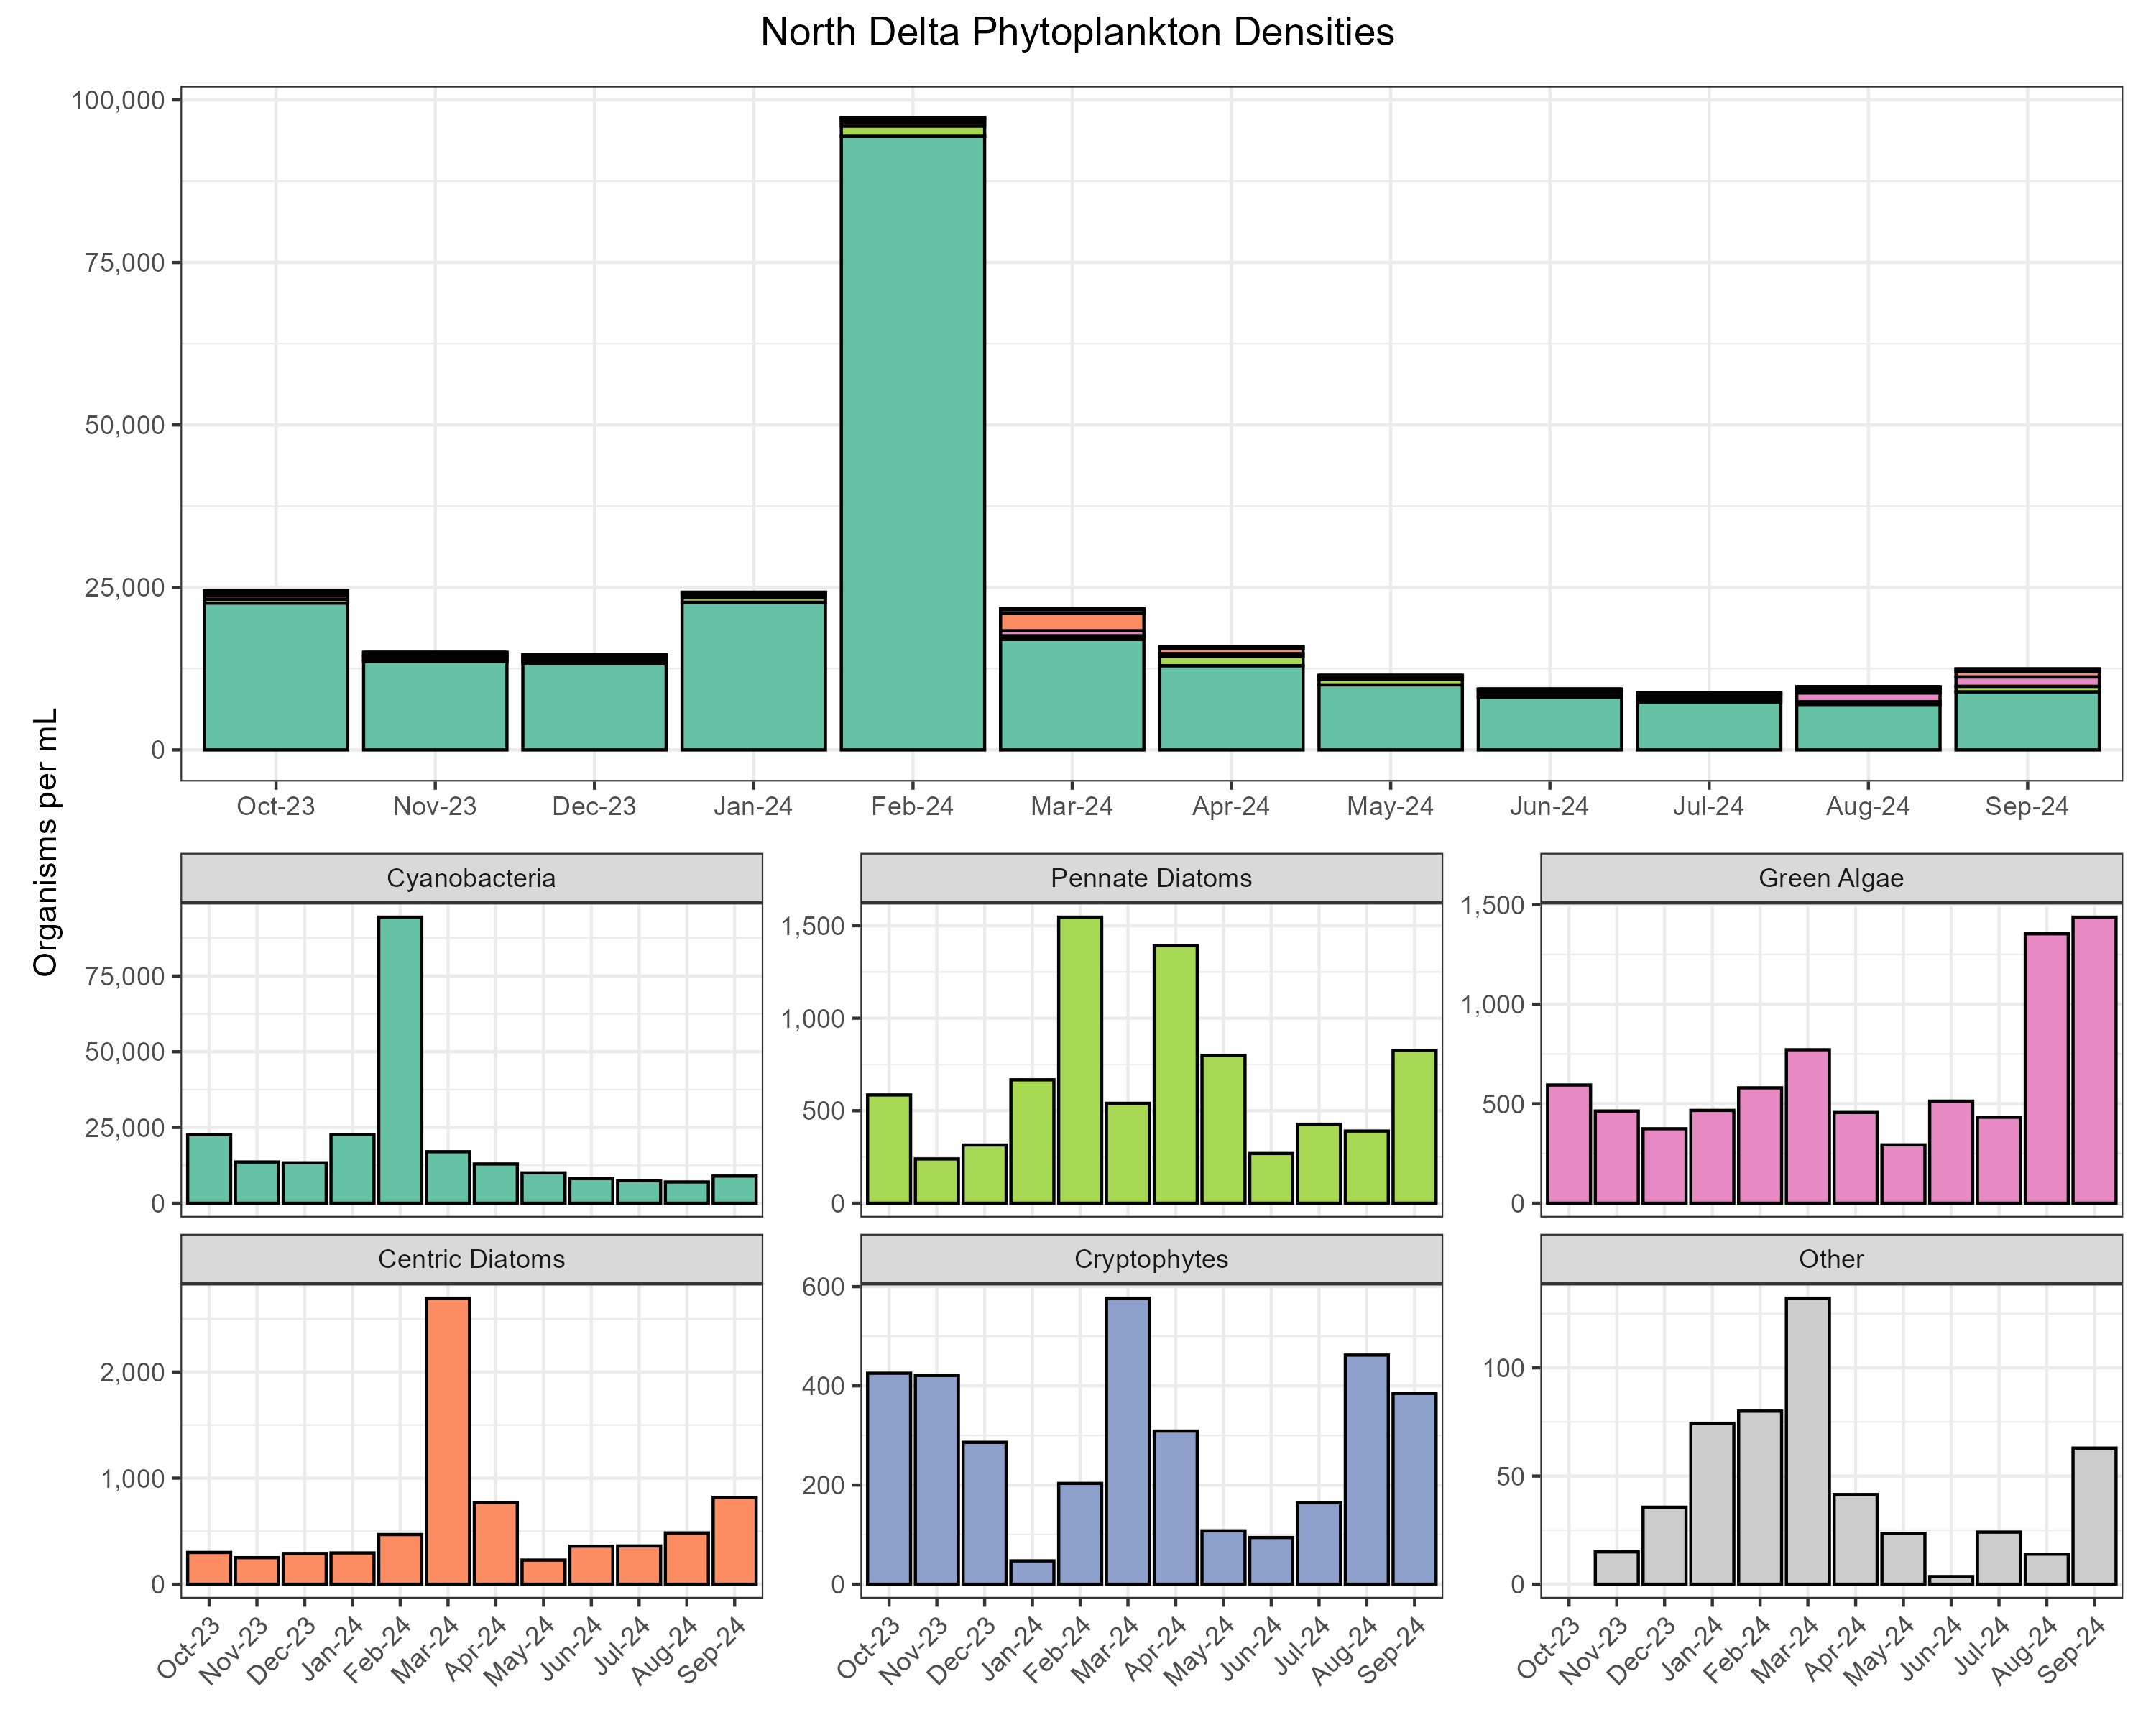
The most abundant algal groups were cyanobacteria (90.7% of organisms, µ = 19834 ± 36210 organisms/mL), green algae (2.8% of organisms, µ = 618 ± 873 organisms/mL), centric diatoms (2.6% of organisms, µ = 568 ± 744 organisms/mL), pennate diatoms (2.5% of organisms, µ = 536 ± 1029 organisms/mL), and cryptophytes (1.2% of organisms, µ = 270 ± 259 organisms/mL). The remaining 0.1% of organisms were comprised of chrysophytes, ciliates, and euglenoids (Other, Figure 10).
San Pablo Bay
Water Quality
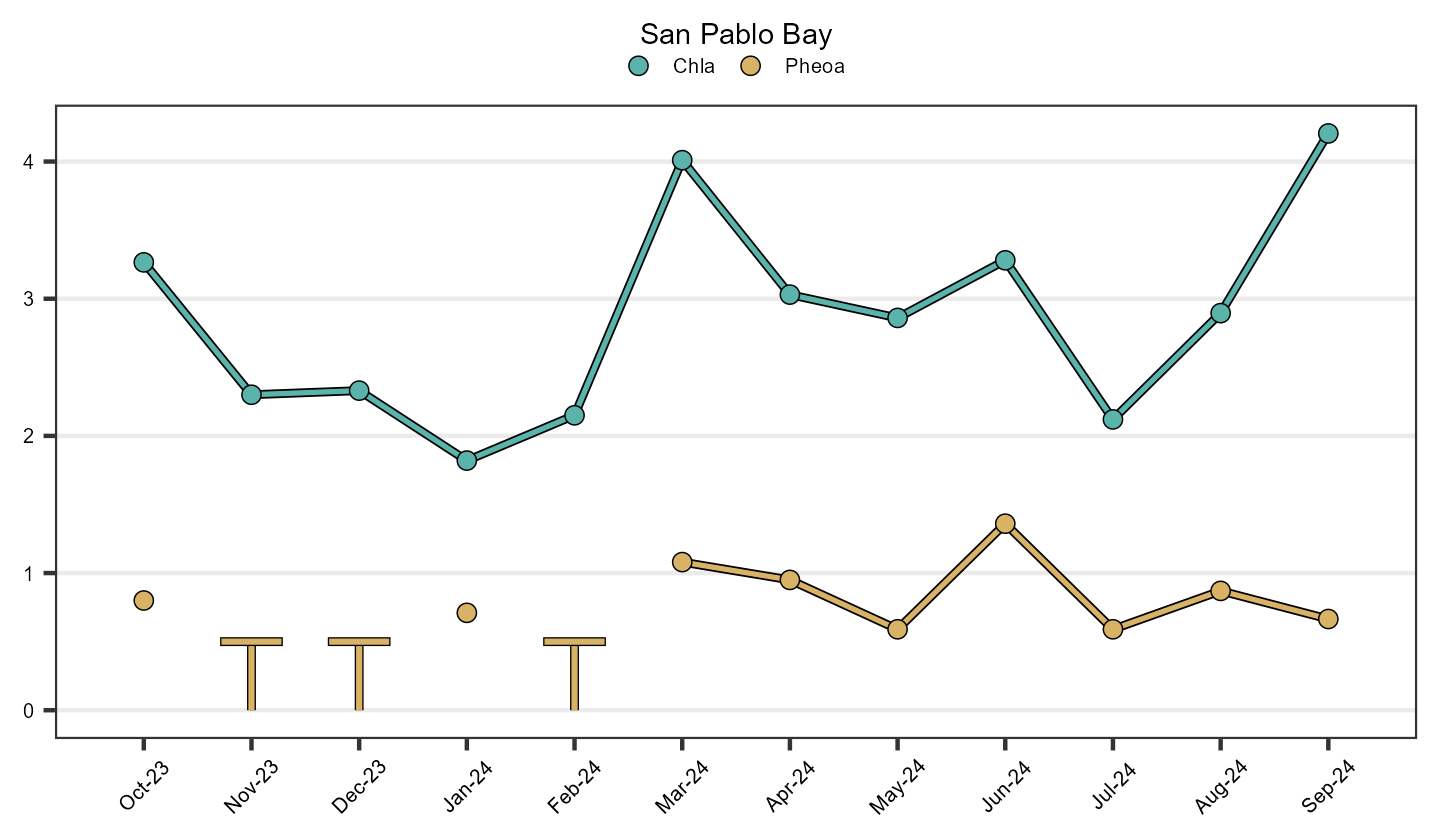
The average chlorophyll a value was 2.64 ± 0.68 µg/L; values ranged from 1.29 µg/L to 5.90 µg/L. The average pheophytin a value was 0.60 ± 0.12 µg/L; values ranged from < 0.50 µg/L to 2.40 µg/L. 40.62% of samples were below the reporting limit. Time series plots averaged over region are shown in Figure 11.
Phytoplankton
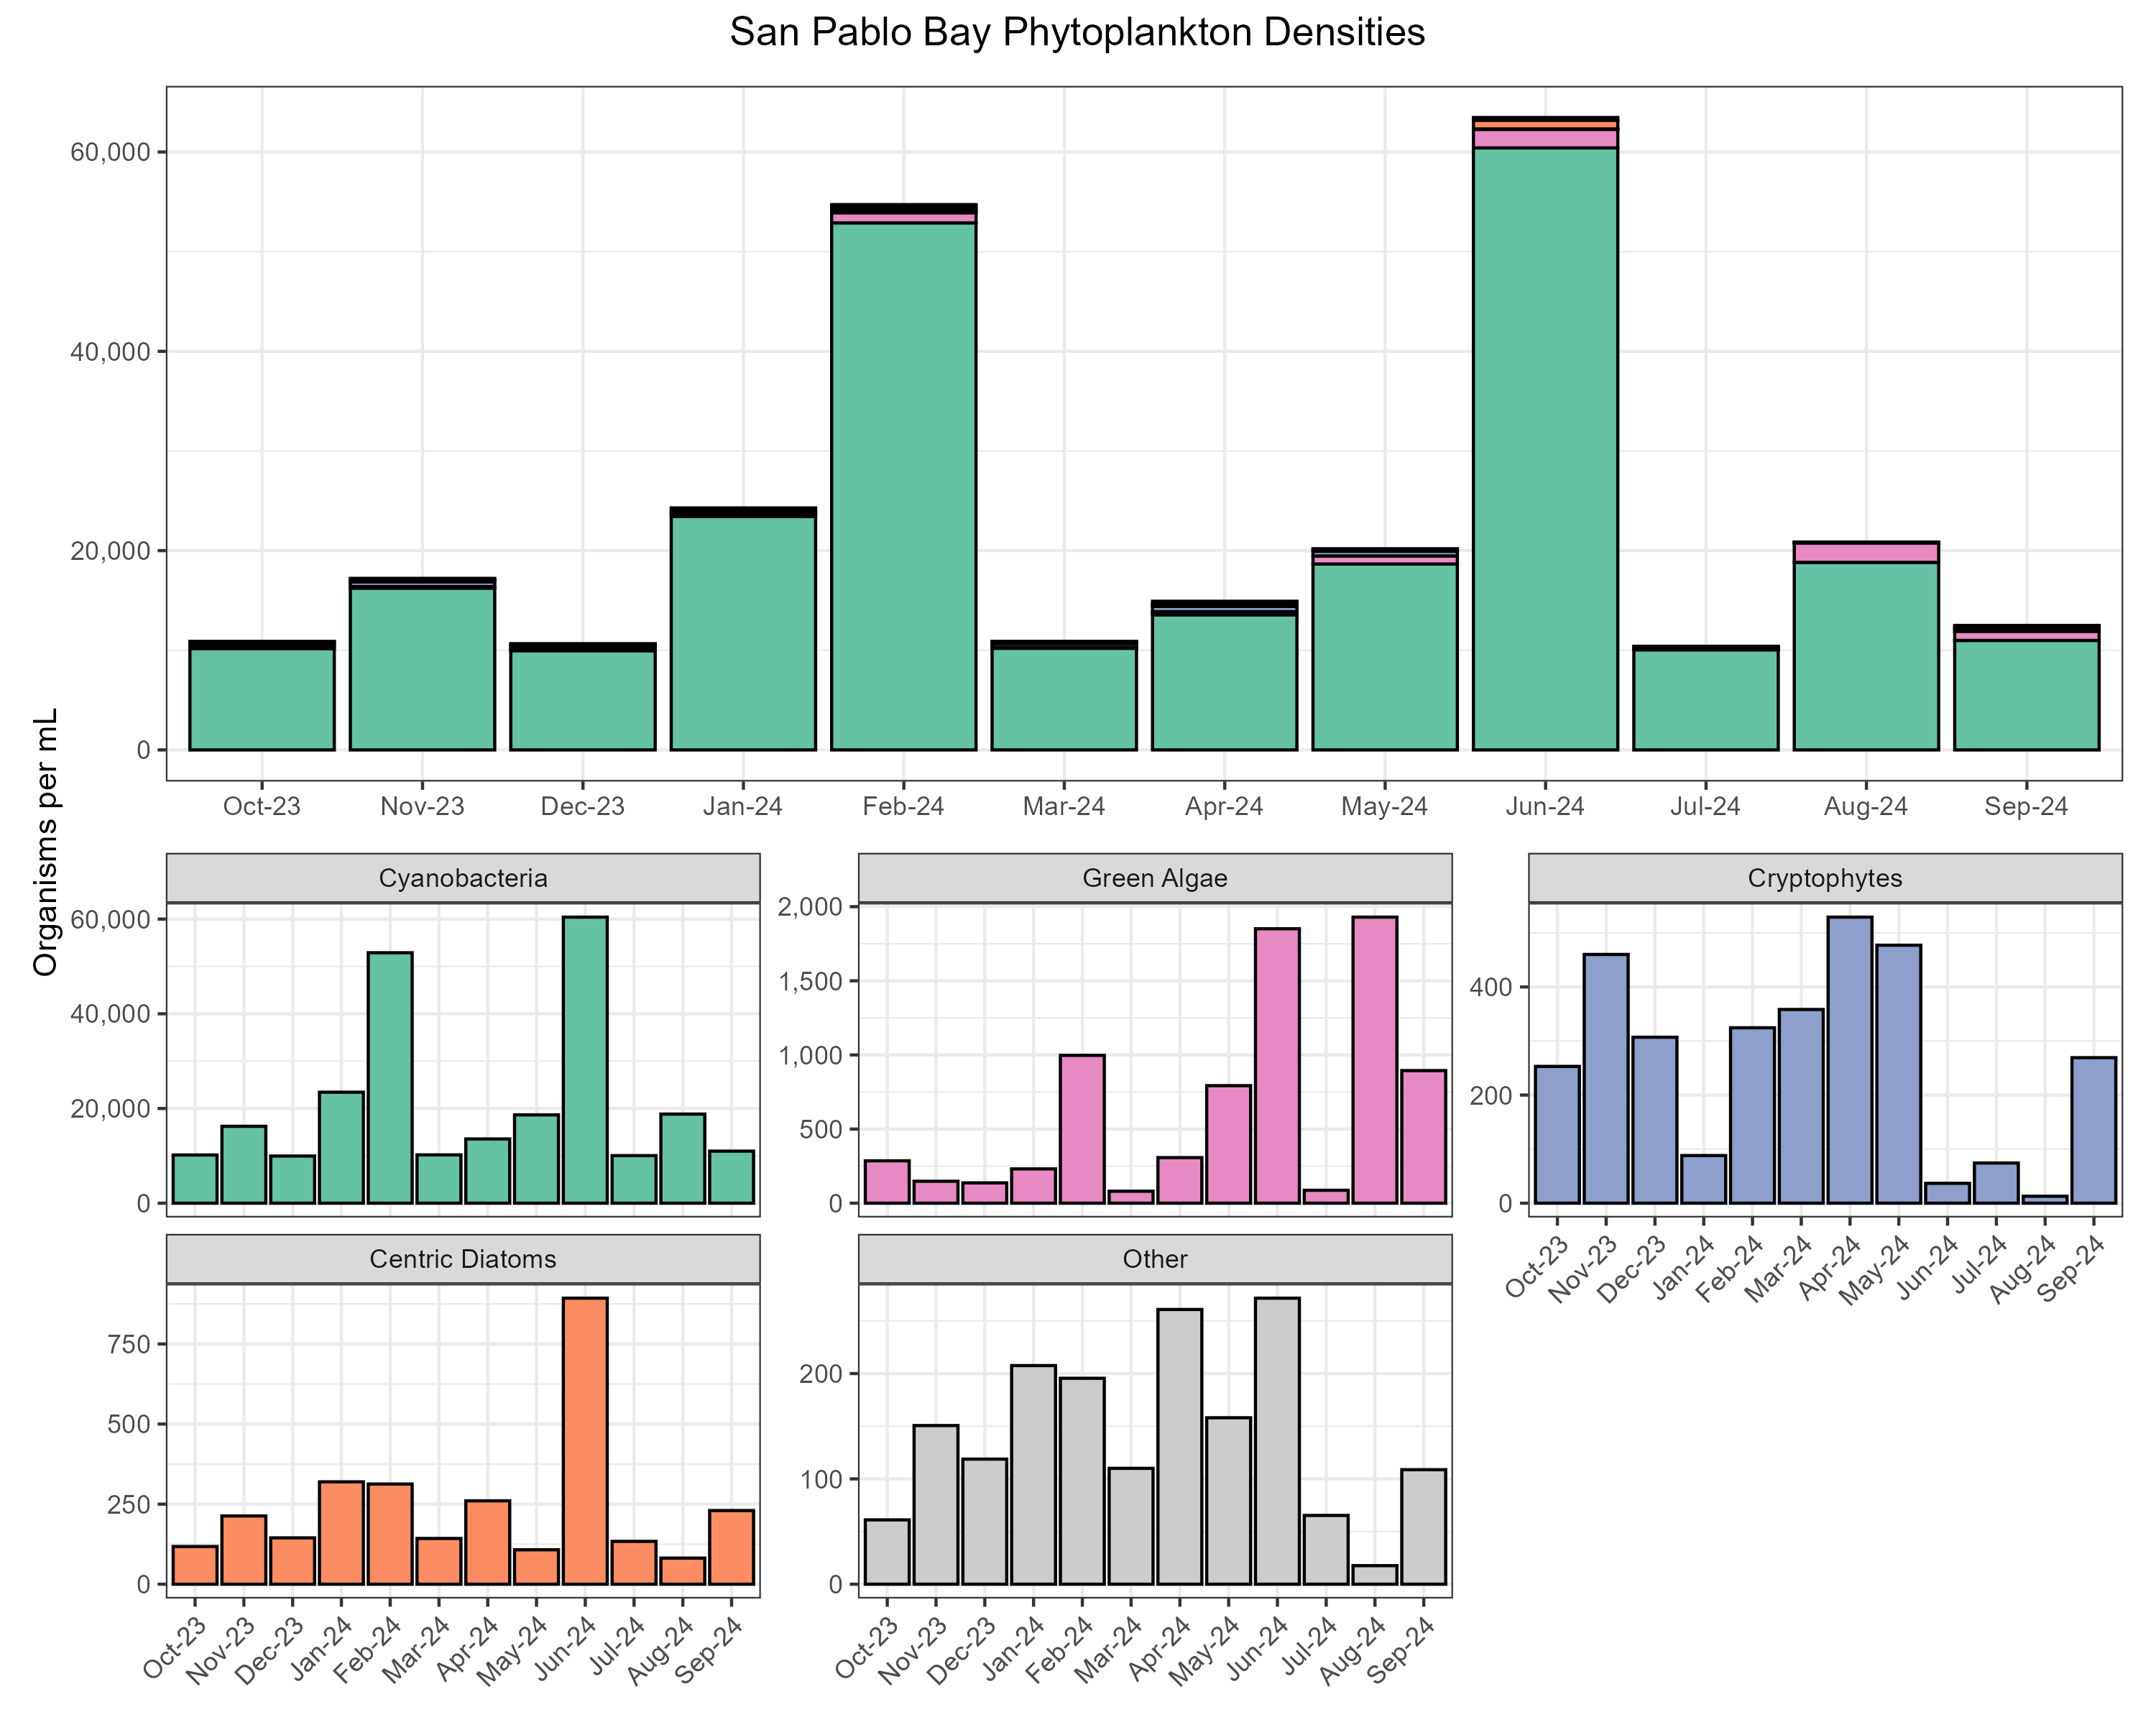
The most abundant algal groups were cyanobacteria (94.9% of organisms, µ = 22375 ± 25193 organisms/mL), green algae (2.6% of organisms, µ = 612 ± 991 organisms/mL), and cryptophytes (1.1% of organisms, µ = 250 ± 239 organisms/mL). The remaining 1.4% of organisms were comprised of centric diatoms, chrysophytes, ciliates, dinoflagellates, euglenoids, and pennate diatoms (Other, Figure 12).
South Delta
Water Quality
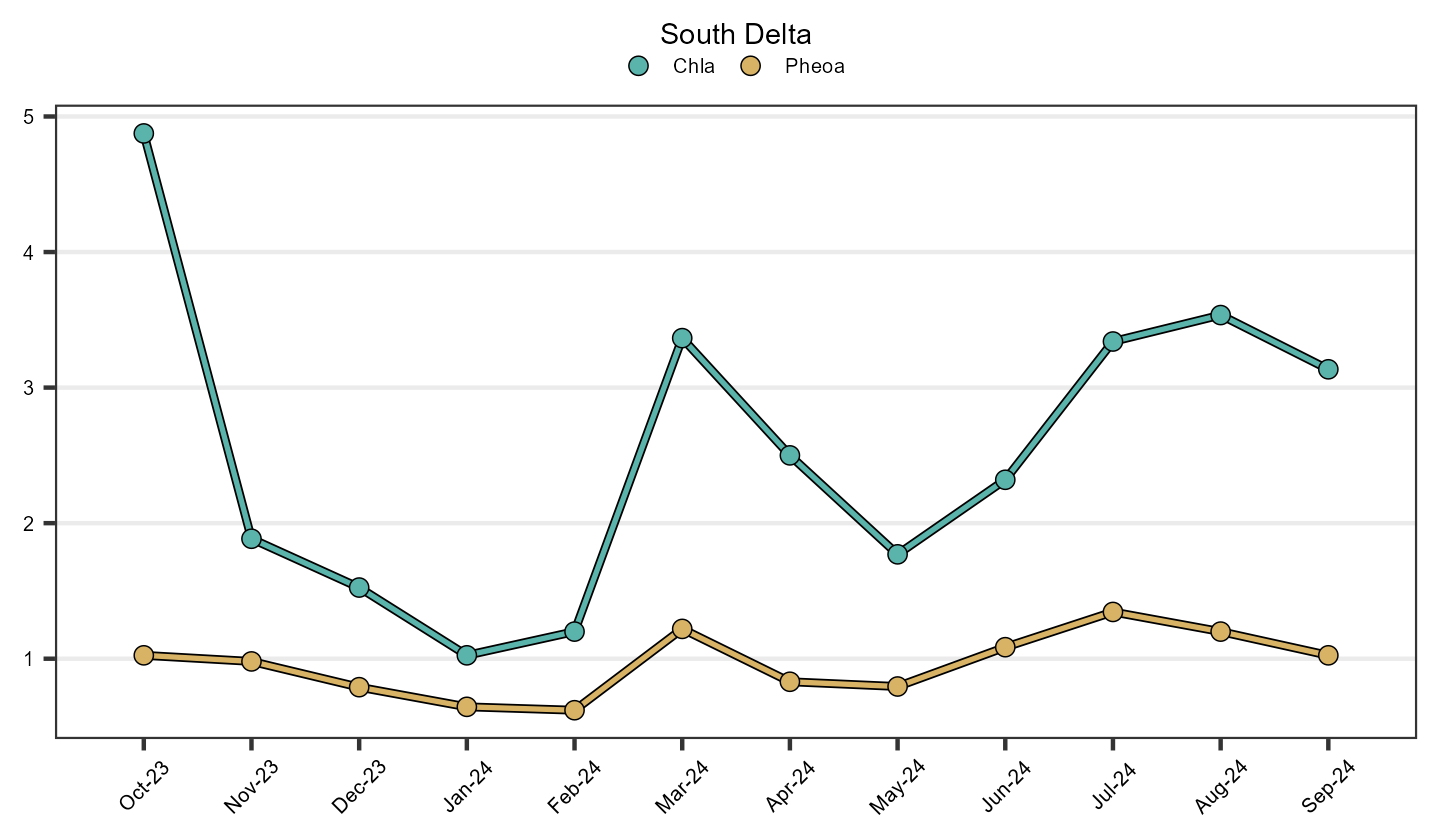
The average chlorophyll a value was 2.13 ± 1.09 µg/L; values ranged from 0.74 µg/L to 53.10 µg/L. The average pheophytin a value was 1.00 ± 0.38 µg/L; values ranged from < 0.50 µg/L to 11.10 µg/L. 12.5% of samples were below the reporting limit. Time series plots averaged over region are shown in Figure 13.
Phytoplankton
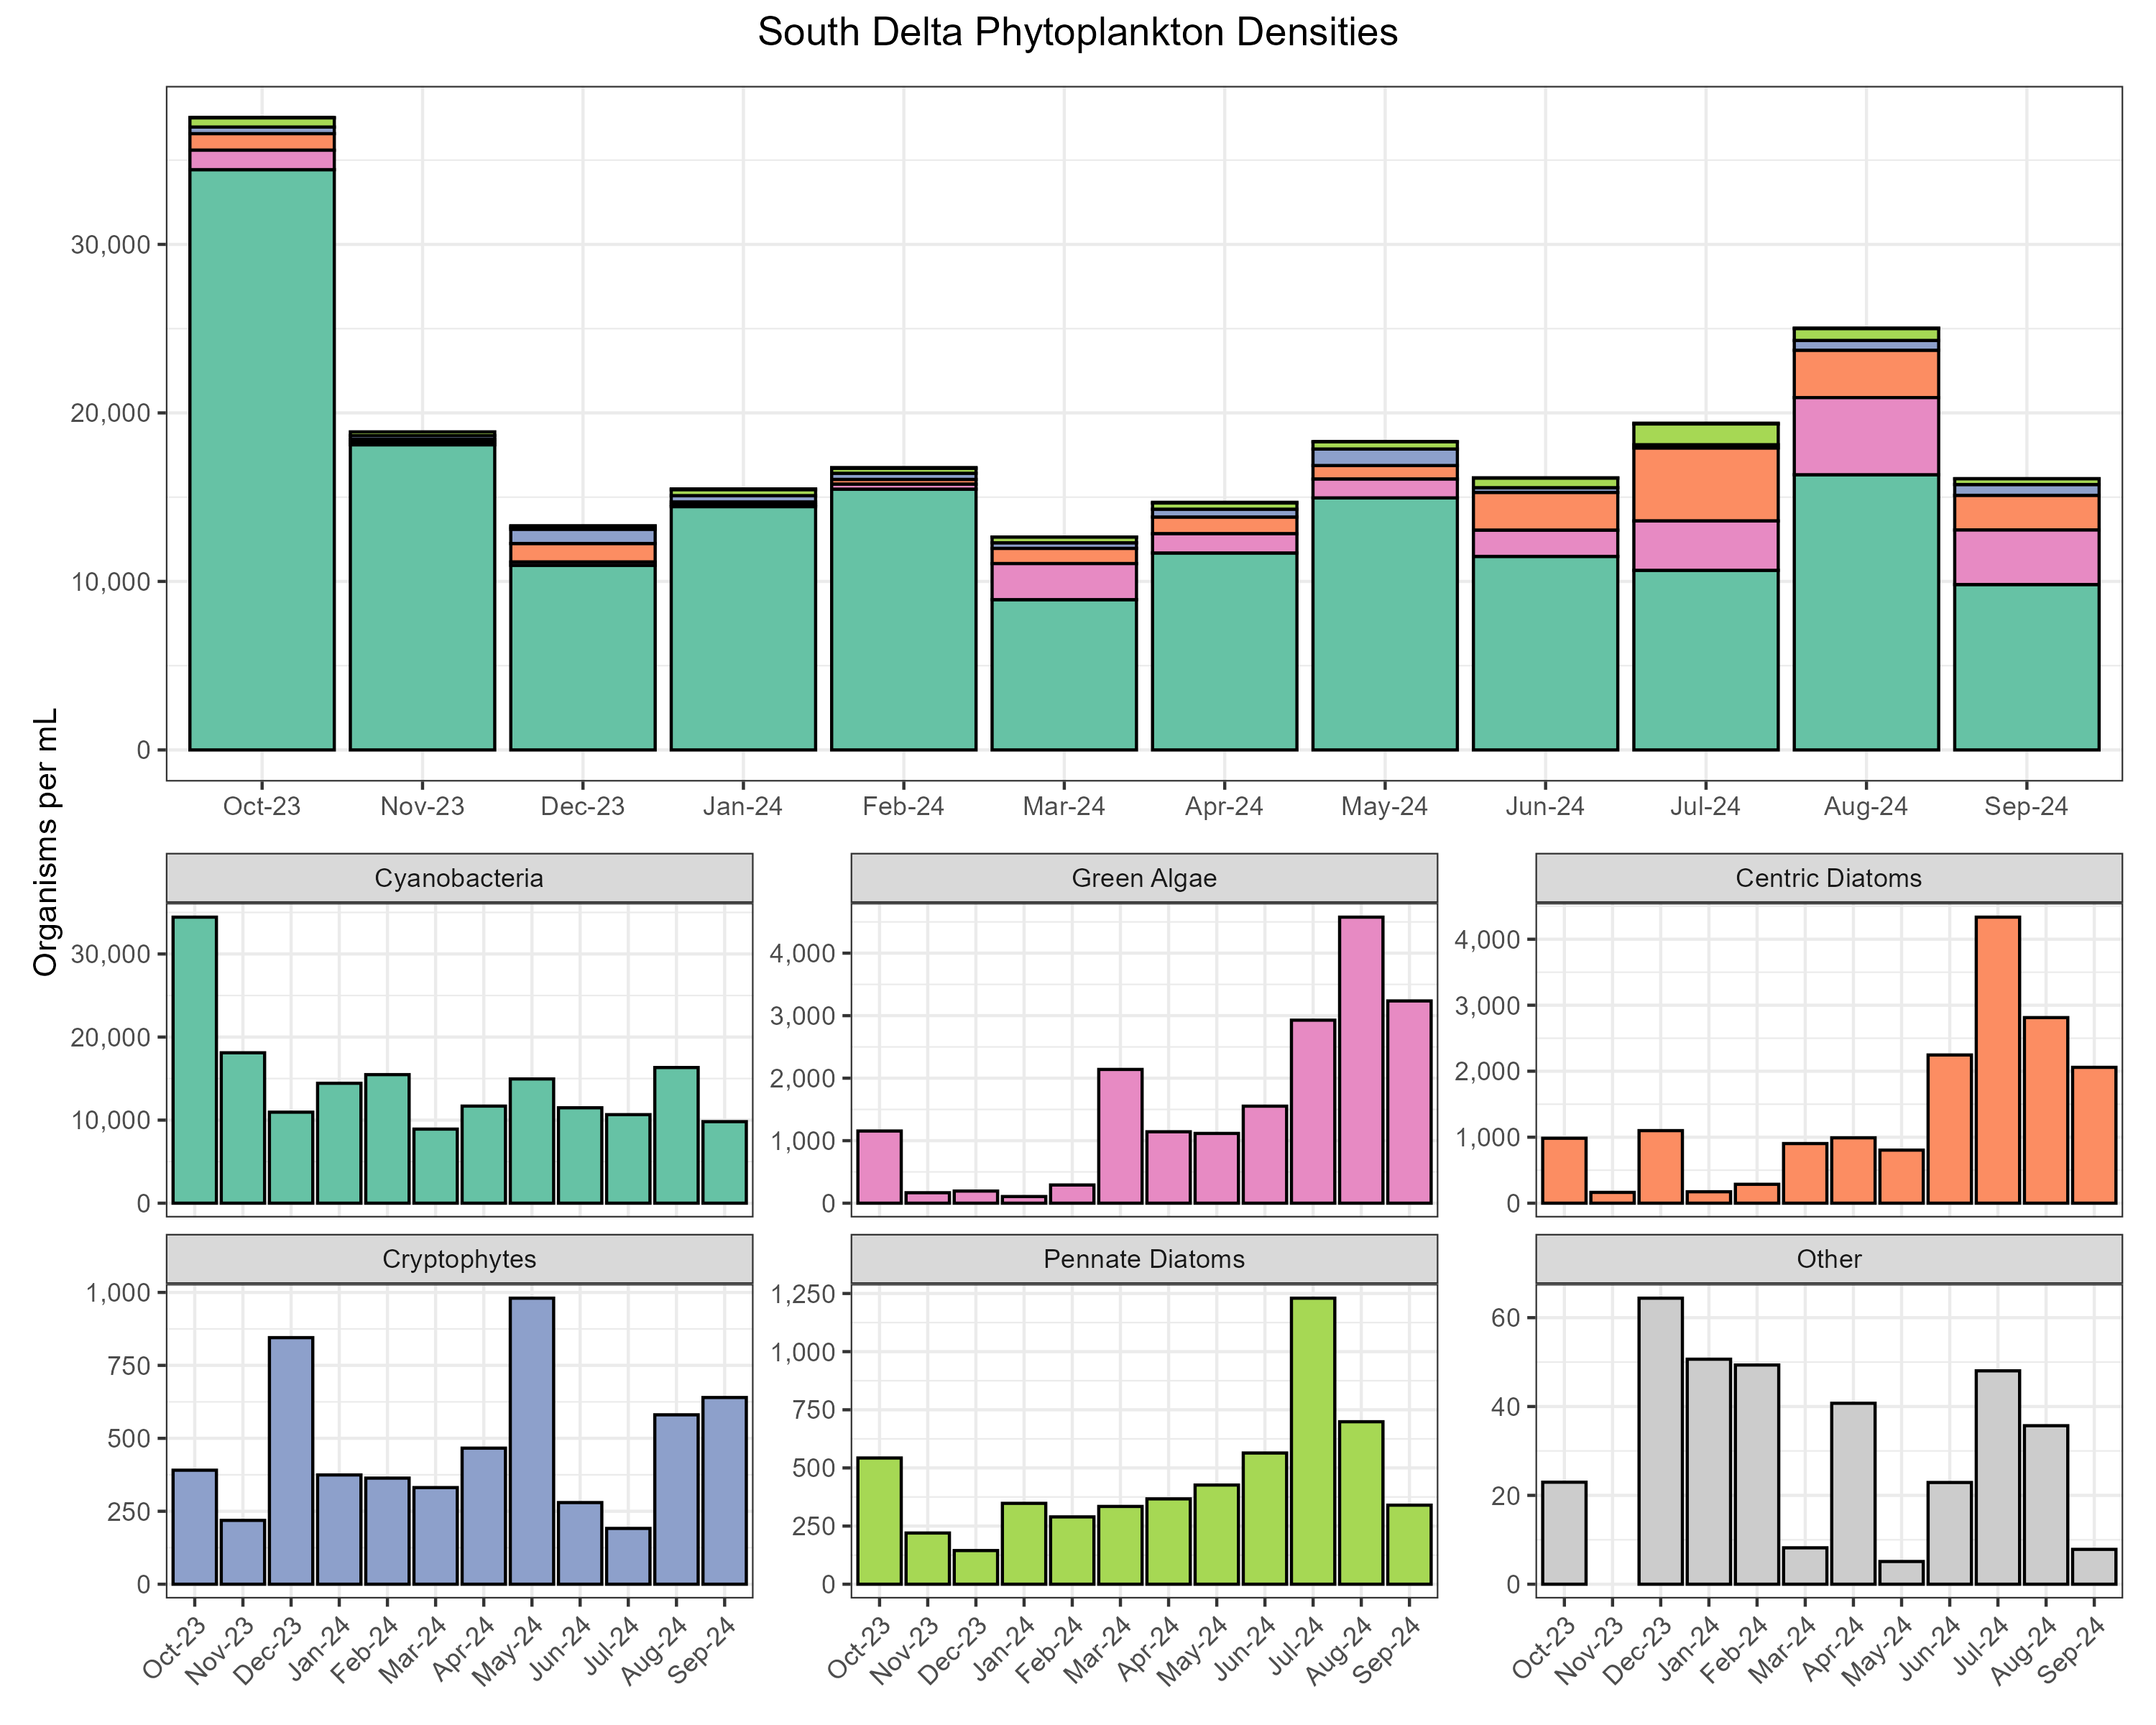
The most abundant algal groups were cyanobacteria (80% of organisms, µ = 14753 ± 23499 organisms/mL), green algae (8.1% of organisms, µ = 1495 ± 2839 organisms/mL), centric diatoms (7.4% of organisms, µ = 1357 ± 2284 organisms/mL), cryptophytes (2.4% of organisms, µ = 442 ± 474 organisms/mL), and pennate diatoms (2% of organisms, µ = 367 ± 686 organisms/mL). The remaining 0.1% of organisms were comprised of chrysophytes, ciliates, coccolithophores, and euglenoids (Other, Figure 14).
Suisun and Grizzly Bays
Water Quality
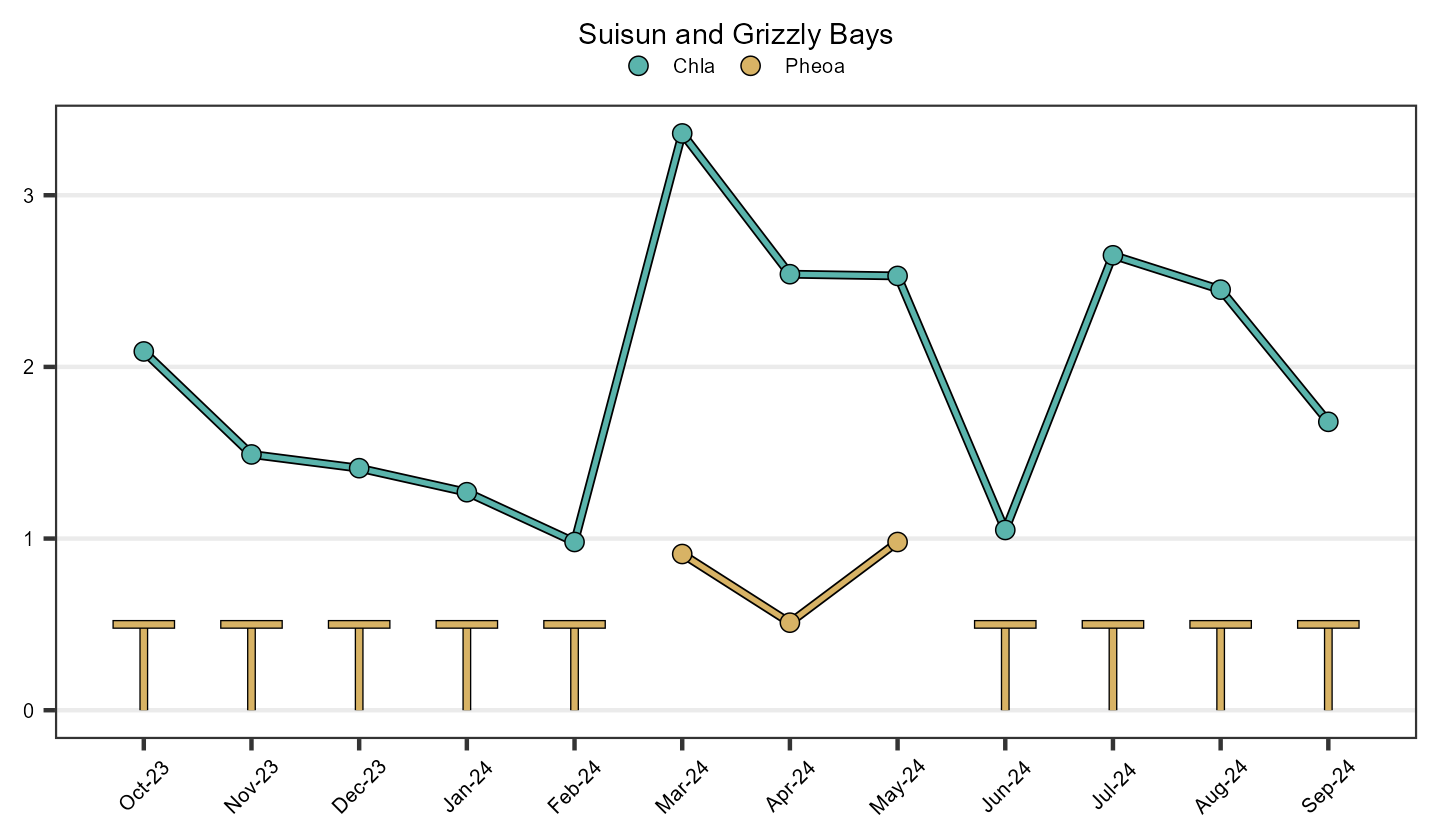
The average chlorophyll a value was 1.93 ± 0.69 µg/L; values ranged from 0.90 µg/L to 7.53 µg/L. The average pheophytin a value was 0.50 ± 0.12 µg/L; values ranged from < 0.50 µg/L to 1.26 µg/L. 55.56% of samples were below the reporting limit. Time series plots averaged over region are shown in Figure 15.
Phytoplankton
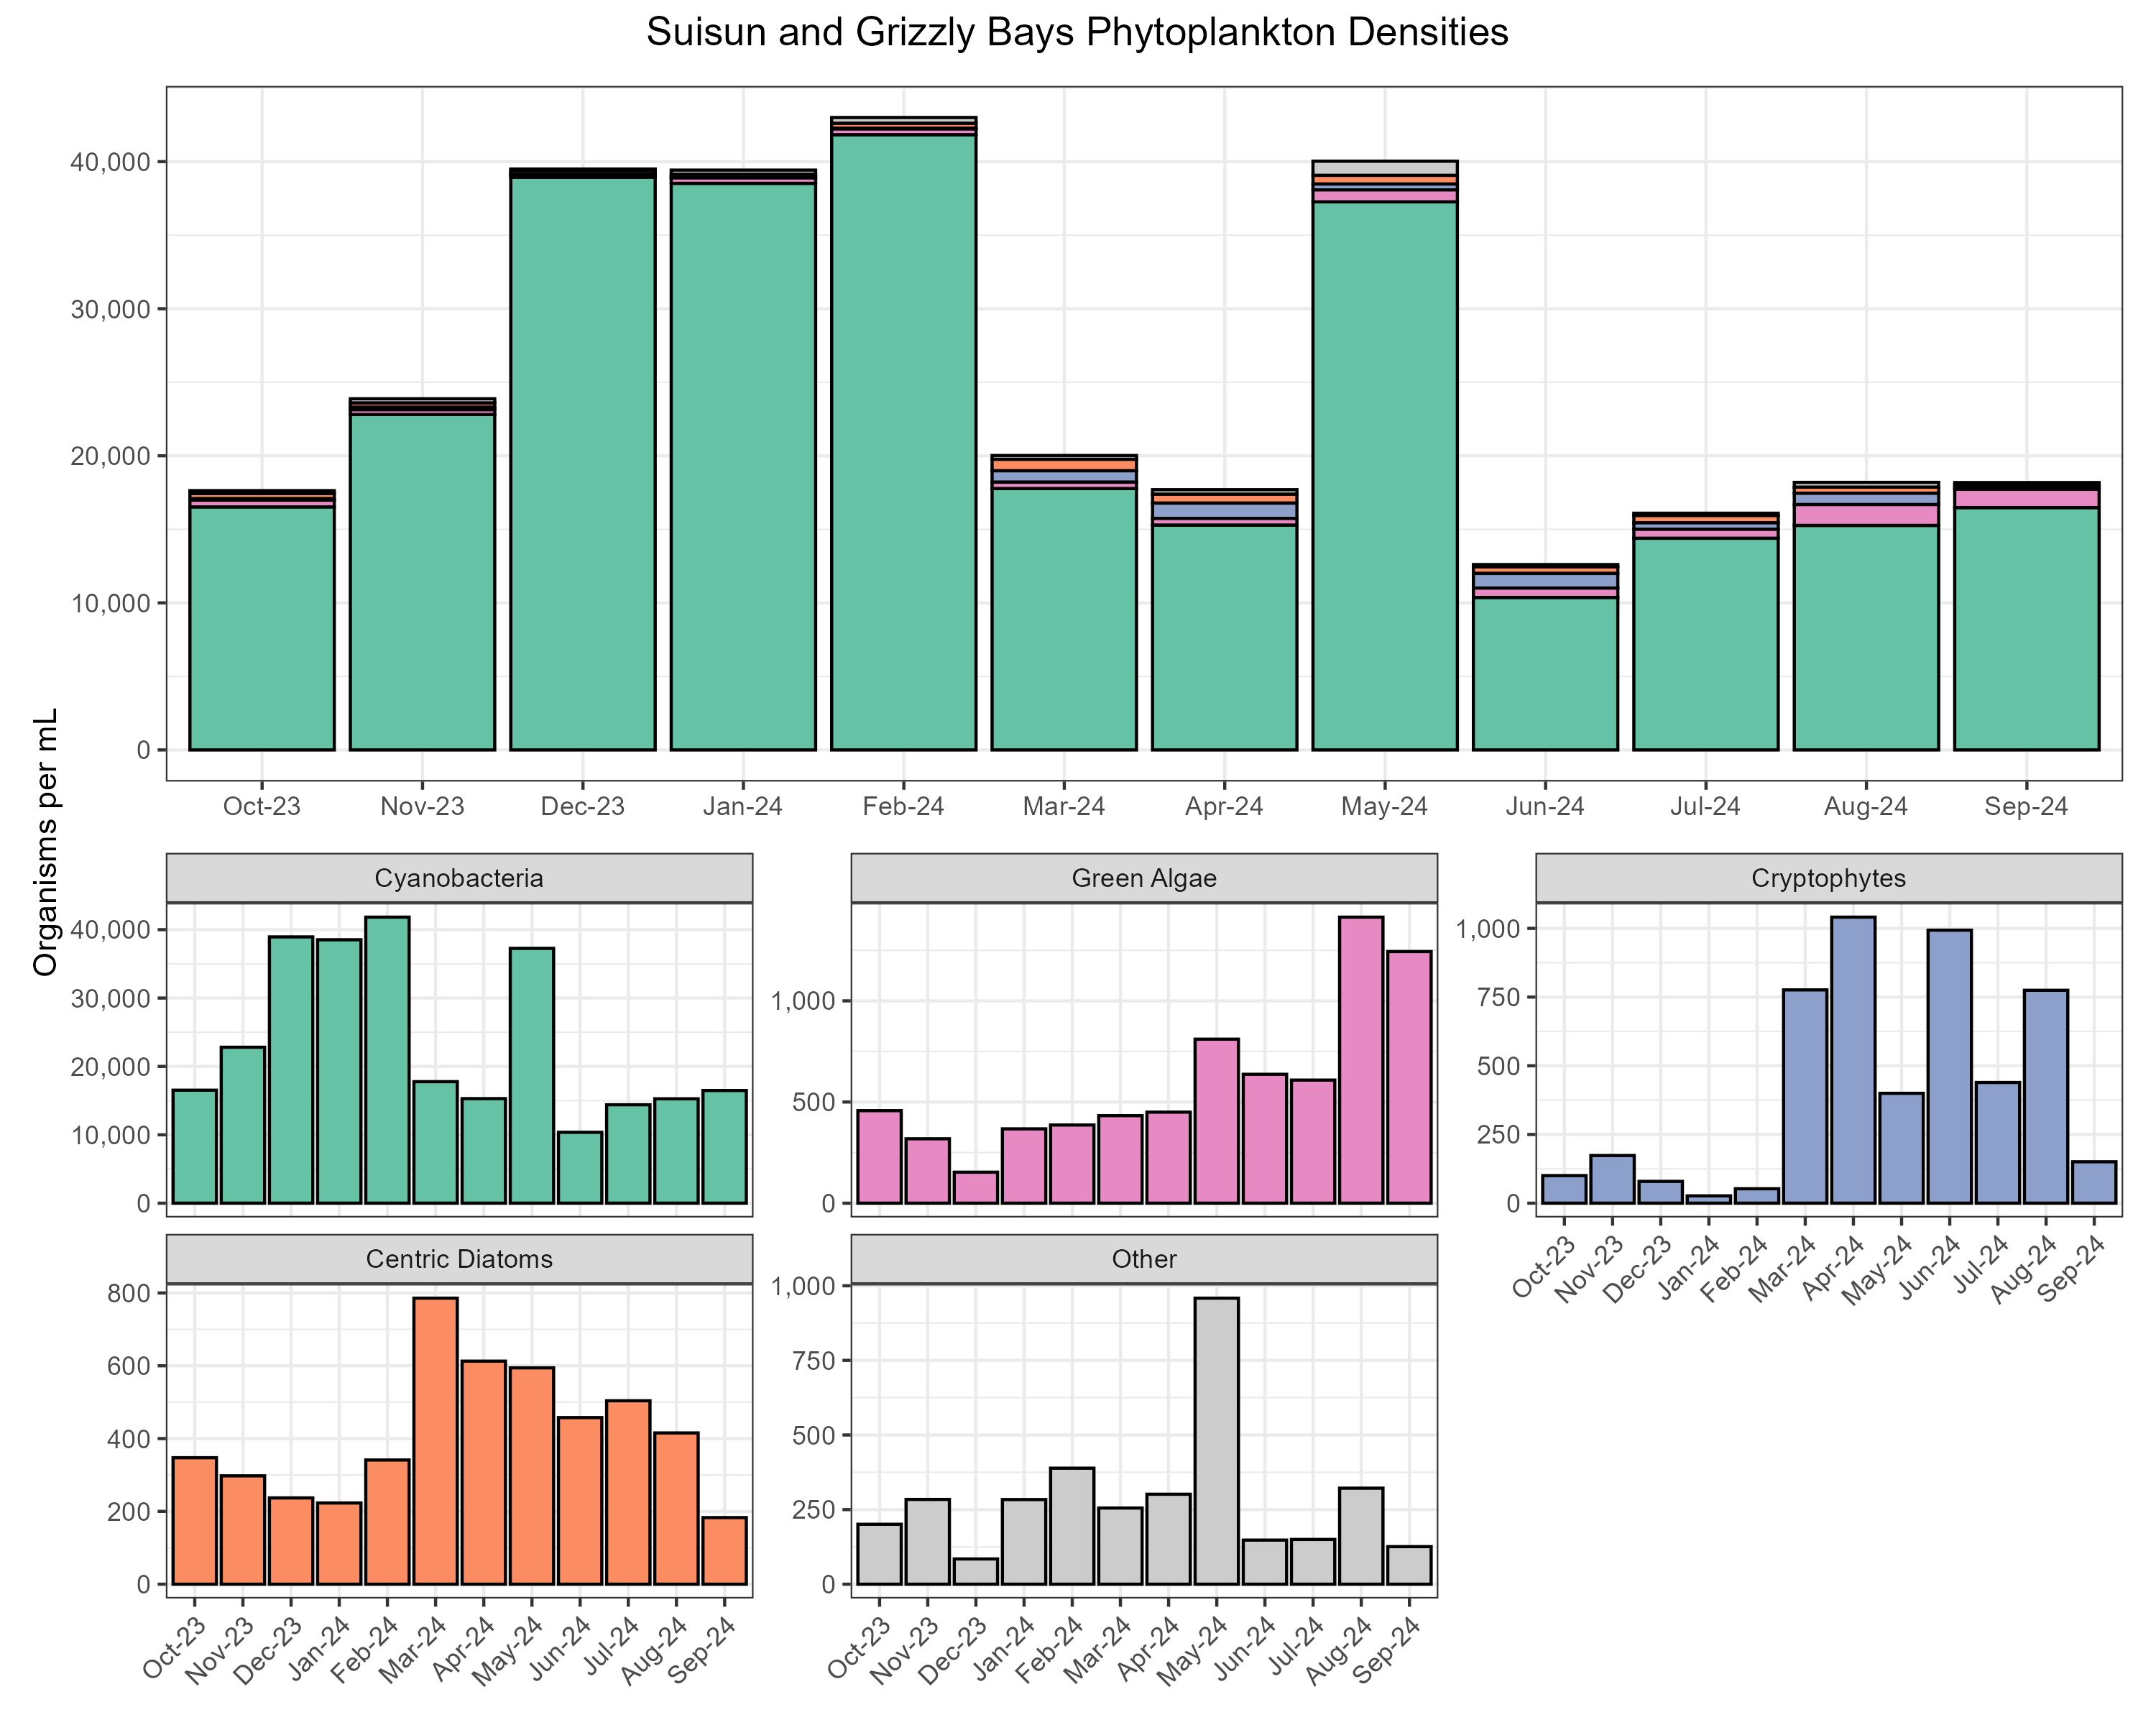
The most abundant algal groups were cyanobacteria (93.9% of organisms, µ = 23785 ± 17334 organisms/mL), green algae (2.3% of organisms, µ = 580 ± 664 organisms/mL), cryptophytes (1.5% of organisms, µ = 380 ± 377 organisms/mL), and centric diatoms (1.4% of organisms, µ = 363 ± 308 organisms/mL). The remaining 0.8% of organisms were comprised of chrysophytes, ciliates, dinoflagellates, euglenoids, and pennate diatoms (Other, Figure 16).
Suisun Marsh
Water Quality
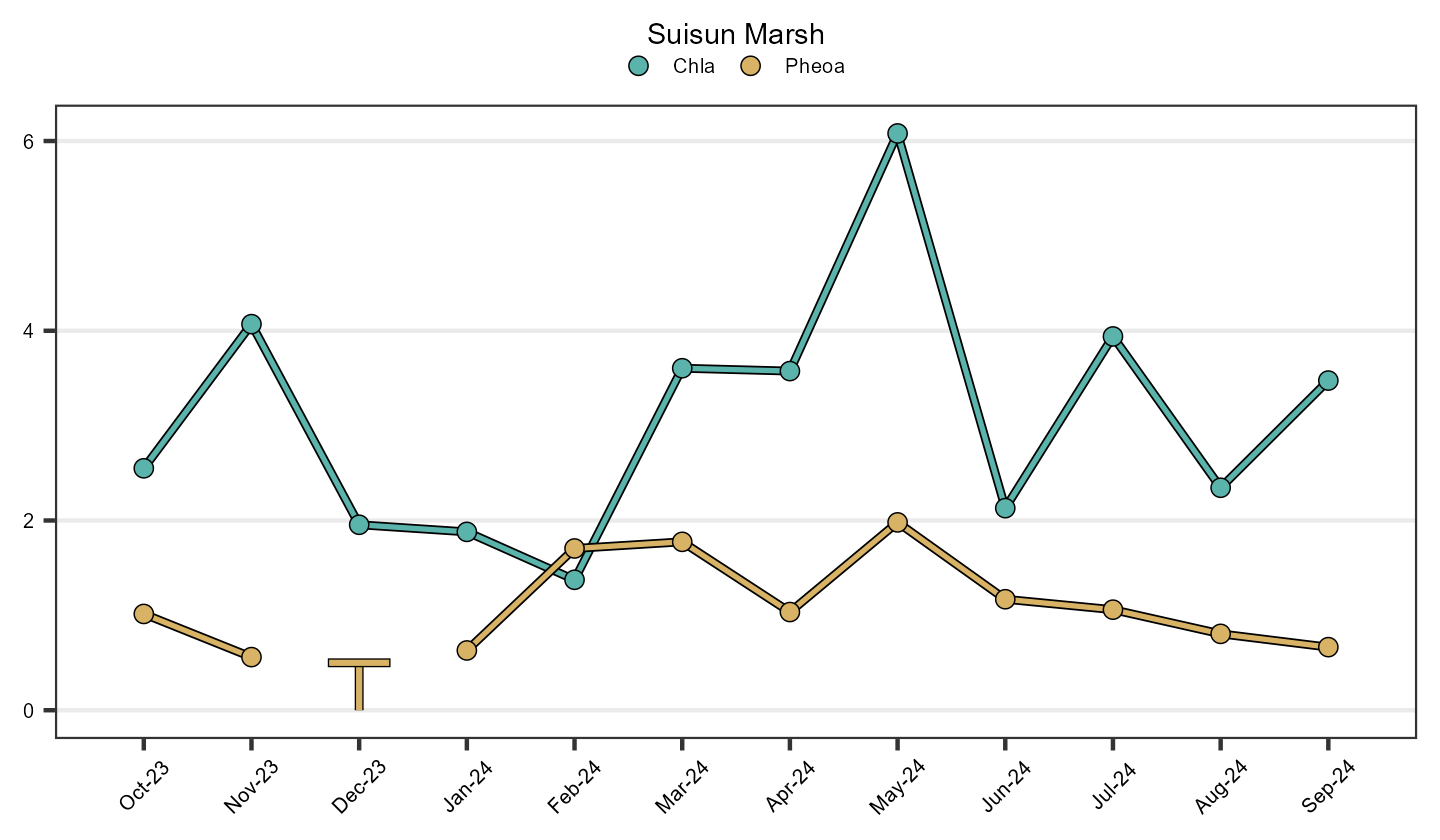
The average chlorophyll a value was 3.04 ± 1.08 µg/L; values ranged from 1.28 µg/L to 8.54 µg/L. . The average pheophytin a value was 0.79 ± 0.17 µg/L; values ranged from < 0.50 µg/L to 1.99 µg/L. 12.5% of samples were below the reporting limit. Time series plots averaged over region are shown in Figure 17.
Phytoplankton
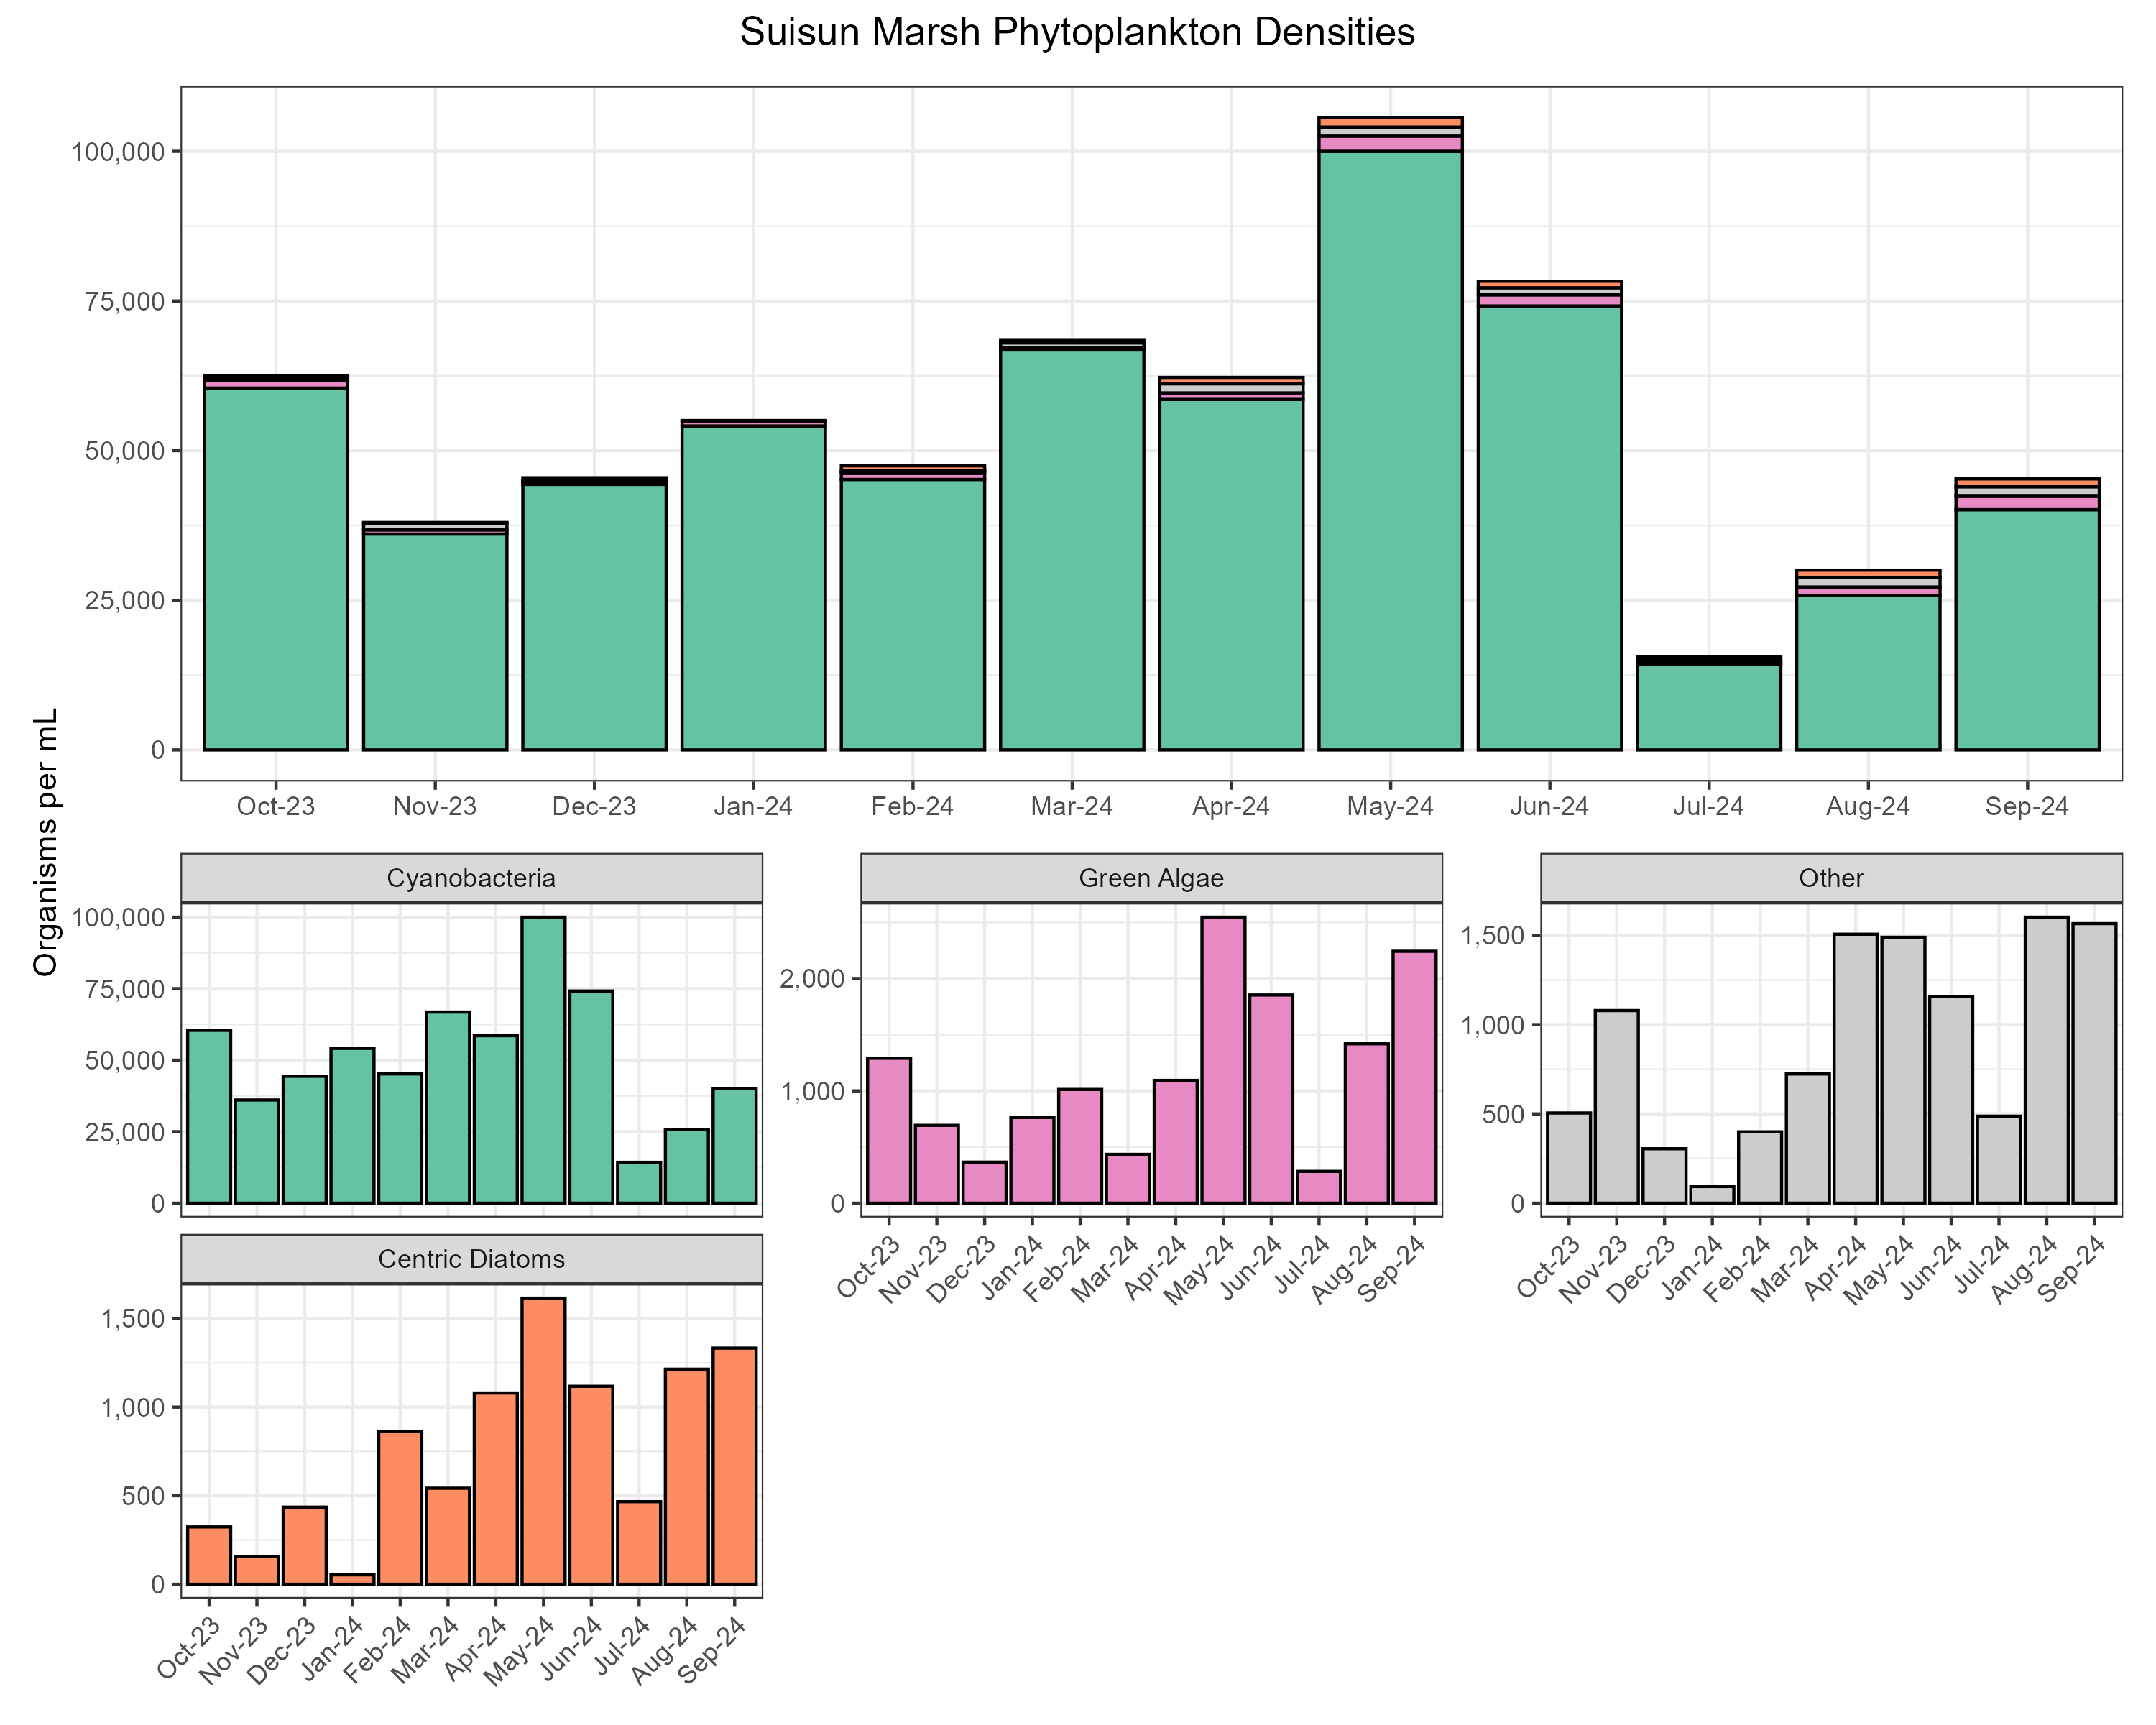
The most abundant algal groups were cyanobacteria (95.7% of organisms, µ = 51644 ± 47335 organisms/mL), green algae (1.9% of organisms, µ = 1041 ± 1218 organisms/mL), and centric diatoms (1.2% of organisms, µ = 646 ± 448 organisms/mL). The remaining 1.1% of organisms were comprised of chrysophytes, ciliates, coccolithophores, cryptophytes, dinoflagellates, euglenoids, and pennate diatoms (Other, Figure 18).
Interpretations
Water year 2024 was above average in precipitation for both the Sacramento and San Joaquin Rivers and their watersheds. Chlorophyll a and pheophytin a values were low overall, with many samples being below the detection limit. Higher outflows that can occur during wet or above normal water years often reduce the residence time of the water, leading to less opportunities for large algal blooms. The phytoplankton community in all regions was dominated by small, but numerically abundant, cyanobacteria. Phytoplankton fell into 12 distinct categories, similar to previous years, with nearly all groups being found in all regions. However, the top ten taxa fell into just 5 categories, showing that while the overall community is diverse, phytoplankton tend to be numerically dominated by a small number of algal groups.
References
[APHA] American Public Health Association, American Waterworks, and Water Environmental Federation. 2012. Standard Methods for the Examination of Water and Wastewater. 22nd ed. Washington, D.C.: American Public Health Association.
Alpine, A. E., and Cloern, J. E. 1992. Trophic interactions and direct physical effects control phytoplankton biomass and production in an estuary. Limnol. Oceanogr. 37: 946-955
Carmichael, W., ed. 1981. The Water Environment, Algal Toxins and Health. Plenum Press, New York, N. Y.
Gannon, J. E. and R. S. Stemberger. 1978. Zooplankton (especially crustaceans and rotifers) as indicators of water quality. Trans. Amer. Microsc. 97:16.
Horne, A. and Goldman, C. 1994. Limnology. 2nd ed. New York, New York, McGraw-Hill, Inc.
Müller-Solger AB, Jassby AD, Müller-Navarra DC. 2002. Nutritional quality of food resources for zooplankton (Daphnia) in a tidal freshwater system (Sacramento-San Joaquin River Delta). Limnology and Oceanography 47(5): 1468-1476.
Utermöhl, H. 1958. Zur Vervollkommnung der quantitativen Phytoplankton Methodik. Mitt. Int. Verh. Limnol. 9: 38.
van den Hoek, C., D.G. Mann, and H.M. Jahns. 1995. Algae: an introduction to Phycology. Cambridge University Press, United Kingdom.
Archived Reports
Previous EMP phytoplankton reports can be found here.